
Tổng quan
Chiến lược này là một chiến lược giao dịch tùy chọn theo dõi xu hướng dựa trên một loạt các chỉ số kỹ thuật. Chiến lược này sử dụng giao dịch EMA như một tín hiệu trung tâm, kết hợp với SMA, VWAP để xác nhận hướng xu hướng và lọc tín hiệu bằng MACD và RSI như một chỉ số phụ. Chiến lược này sử dụng quản lý rủi ro điểm dừng cố định để tăng tỷ lệ thành công của giao dịch thông qua điều kiện nhập cảnh và quản lý vị trí nghiêm ngặt.
Nguyên tắc chiến lược
Chiến lược sử dụng chéo của 8 chu kỳ và 21 chu kỳ EMA như tín hiệu giao dịch chính, kích hoạt nhiều tín hiệu khi ngắn hạn EMA vượt qua dài hạn EMA và đáp ứng các điều kiện sau: Giá nằm trên 100 và 200 chu kỳ SMA, MACD đường trên đường tín hiệu, RSI lớn hơn 50. Các điều kiện kích hoạt của tín hiệu tháo là ngược lại. Chiến lược giới thiệu VWAP làm tham chiếu trọng lượng giá để giúp xác định vị trí tương đối của giá hiện tại.
Lợi thế chiến lược
- Hợp tác nhiều chỉ số, tăng độ tin cậy của tín hiệu thông qua xác minh chéo các chỉ số khác nhau và loại
- Sử dụng phương pháp kết hợp theo dõi xu hướng và chỉ số động lực để nắm bắt xu hướng và chú ý đến động lực ngắn hạn
- Đặt điểm dừng cố định giúp bảo vệ lợi nhuận và tránh tham lam quá mức
- Kiểm soát chặt chẽ, tránh mở cửa nhiều lần, giảm rủi ro
- Hiển thị rõ ràng, bao gồm EMA, SMA, VWAP và dấu hiệu tín hiệu
Rủi ro chiến lược
- Tín hiệu sai thường xuyên có thể xảy ra trong thị trường biến động
- Đặt điểm dừng cố định có thể khiến bạn bỏ lỡ cơ hội lợi nhuận lớn hơn
- Không có thiết lập dừng lỗ, có thể chịu tổn thất lớn trong trường hợp cực đoan
- Việc sử dụng nhiều chỉ số có thể gây ra sự chậm trễ tín hiệu
- Có thể có rủi ro trượt trong các hợp đồng quyền chọn ít thanh khoản
Hướng tối ưu hóa chiến lược
- Tiến hành các cơ chế dừng lỗ thích ứng, điều chỉnh theo các động thái biến động của thị trường
- Thêm mô-đun quản lý khối lượng giao dịch, điều chỉnh vị trí theo kích thước tài khoản và tình hình thị trường
- Thêm bộ lọc biến động thị trường, điều chỉnh các tham số chiến lược trong môi trường biến động cao
- Tối ưu hóa tham số chỉ số, có thể xem xét sử dụng chu kỳ thích ứng thay vì chu kỳ cố định
- Thêm bộ lọc thời gian để tránh giao dịch trong thời gian có biến động lớn như thị trường mở và đóng cửa
Tóm tắt
Đây là một chiến lược giao dịch tùy chọn theo dõi xu hướng đa chỉ số có cấu trúc, logic rõ ràng. Chiến lược này giúp tăng độ tin cậy của tín hiệu giao dịch bằng cách phối hợp với nhiều chỉ số kỹ thuật và sử dụng điểm dừng cố định để quản lý rủi ro. Mặc dù có một số rủi ro vốn có trong chiến lược, nhưng hướng tối ưu hóa được đưa ra có thể nâng cao hơn nữa sự ổn định và khả năng sinh lợi của chiến lược. Thiết kế hình ảnh của chiến lược cũng giúp các nhà giao dịch hiểu và thực hiện tín hiệu giao dịch trực quan.
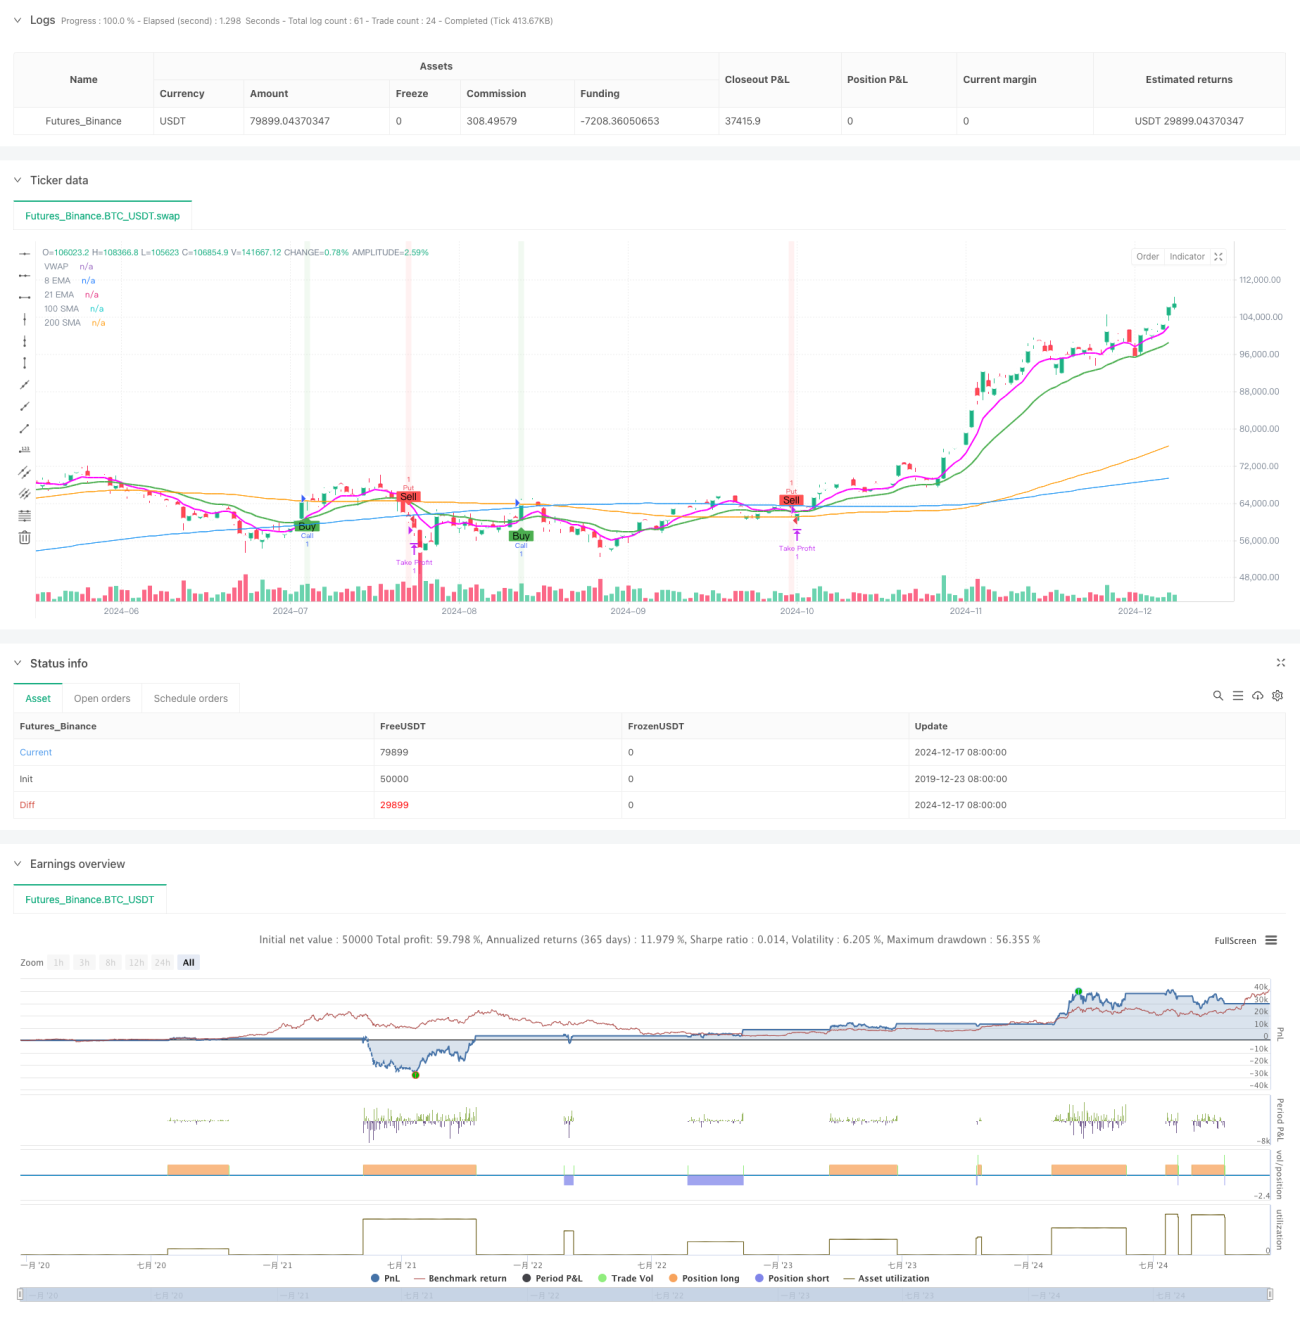
/*backtest
start: 2019-12-23 08:00:00
end: 2024-12-18 08:00:00
period: 1d
basePeriod: 1d
exchanges: [{"eid":"Futures_Binance","currency":"BTC_USDT"}]
*/

//@version=5
strategy("OptionsMillionaire Strategy with Take Profit Only", overlay=true, default_qty_type=strategy.fixed, default_qty_value=1)

// Define custom magenta color- 1