
Tổng quan
Chiến lược này là một hệ thống giao dịch tổng hợp kết hợp nhiều chỉ báo kỹ thuật, chủ yếu nắm bắt cơ hội giao dịch thông qua việc theo dõi động lượng thị trường và sự thay đổi xu hướng một cách linh hoạt. Chiến lược tích hợp nhiều chỉ báo như hệ thống đường trung bình động (EMA), chỉ số sức mạnh tương đối (RSI), chỉ báo phân kỳ hội tụ trung bình động (MACD), dải Bollinger (BB), và đưa vào cơ chế cắt lỗ động dựa trên ATR (Average True Range), thực hiện phân tích đa chiều và kiểm soát rủi ro cho thị trường.
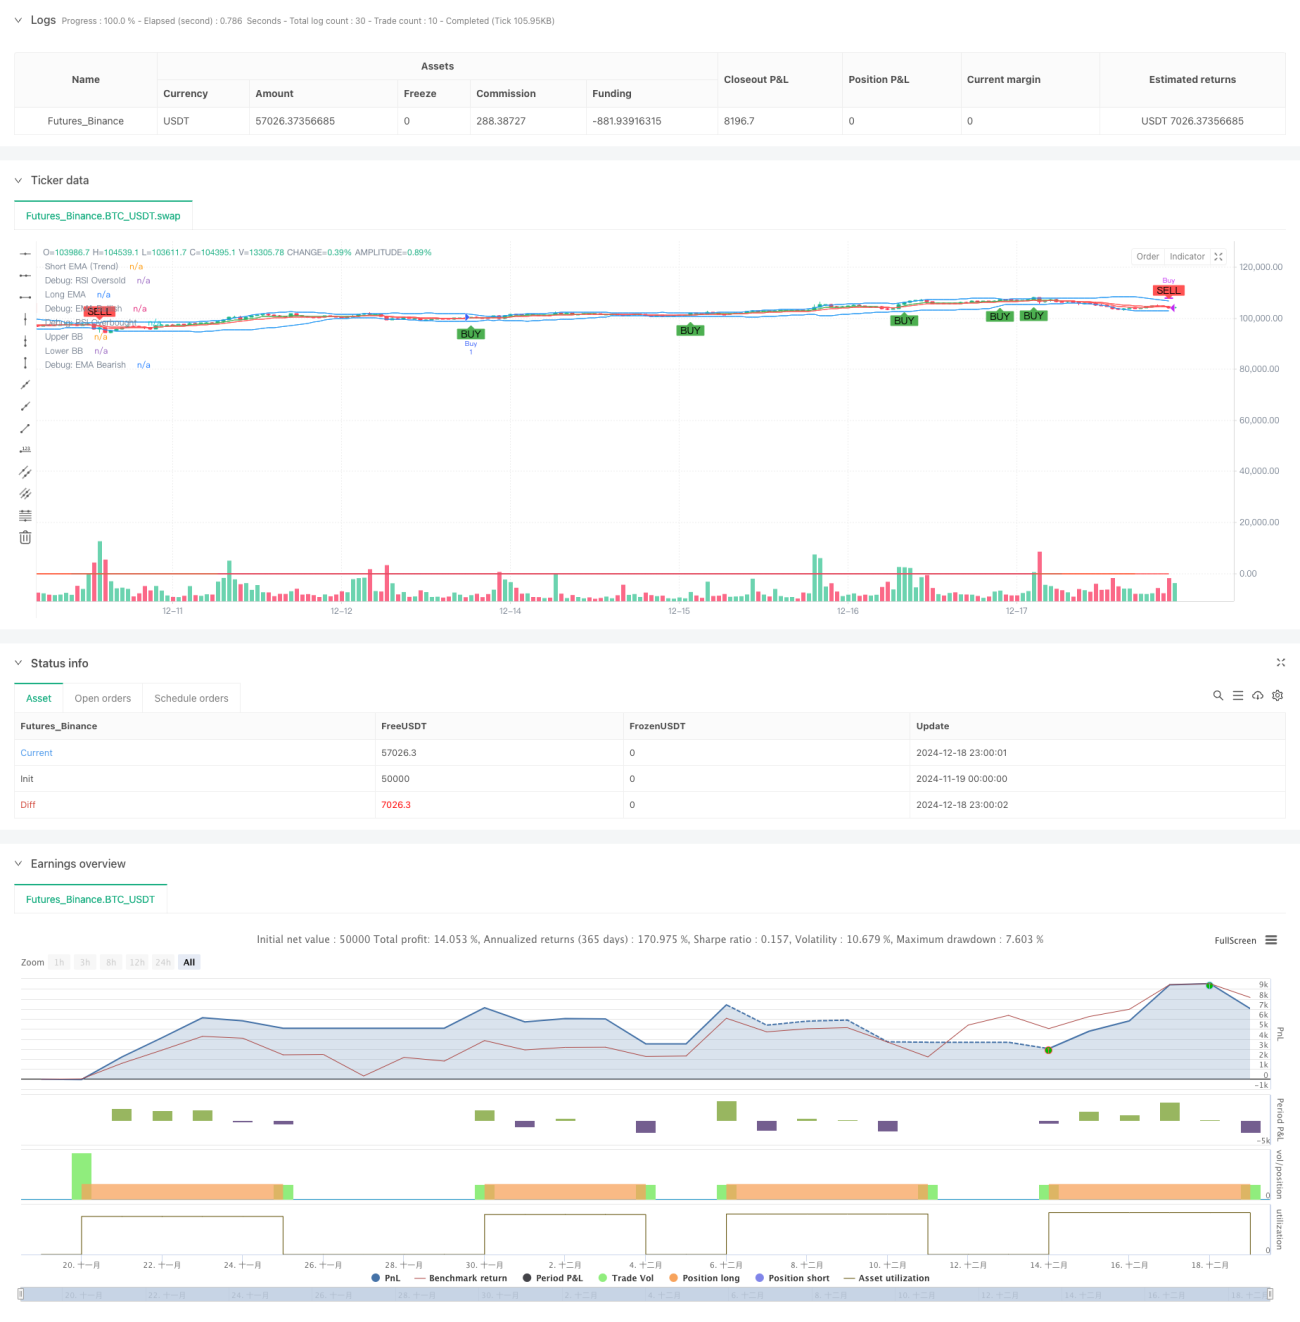
Nguyên lý chiến lược
Chiến lược sử dụng cơ chế xác nhận tín hiệu đa cấp, bao gồm các khía cạnh chính sau:
- Xác định xu hướng: Sử dụng giao cắt của EMA 7 chu kỳ và EMA 14 chu kỳ để xác định hướng xu hướng thị trường.
- Phân tích động lượng: Theo dõi trạng thái quá mua/quá bán của thị trường thông qua chỉ báo RSI, thiết lập ngưỡng động 30/70.
- Xác nhận độ mạnh xu hướng: Đưa vào chỉ báo ADX để đánh giá độ mạnh của xu hướng, khi ADX > 25 xác nhận xu hướng mạnh tồn tại.
- Xác định biên độ dao động: Sử dụng dải Bollinger để xác định biên độ giao động giá, kết hợp với tình huống giá chạm dải Bollinger để tạo tín hiệu giao dịch.
- Xác nhận khối lượng: Sử dụng bộ lọc trung bình động khối lượng động, đảm bảo giao dịch diễn ra khi mức độ hoạt động thị trường đủ lớn.
- Kiểm soát rủi ro: Chiến lược cắt lỗ động được thiết kế dựa trên chỉ báo ATR, khoảng cách cắt lỗ là 1,5 lần ATR.
Ưu điểm chiến lược
- Xác nhận tín hiệu đa chiều, có thể giảm hiệu quả tín hiệu nhiễu.
- Cơ chế cắt lỗ động giúp tăng khả năng thích ứng rủi ro của chiến lược.
- Kết hợp phân tích khối lượng và độ mạnh xu hướng, nâng cao độ tin cậy của giao dịch.
- Các tham số chỉ báo có thể điều chỉnh, tính thích ứng tốt.
- Cơ chế vào và thoát lệnh hoàn chỉnh, logic giao dịch rõ ràng.
- Sử dụng các chỉ báo kỹ thuật chuẩn, dễ hiểu và dễ bảo trì.
Rủi ro chiến lược
- Nhiều chỉ báo có thể dẫn đến độ trễ tín hiệu.
- Tối ưu hóa tham số có thể gặp rủi ro quá khớp (overfitting).
- Trong thị trường đi ngang có thể phát sinh giao dịch thường xuyên.
- Hệ thống tín hiệu phức tạp có thể làm tăng gánh nặng tính toán.
- Cần lượng mẫu lớn để xác thực hiệu quả của chiến lược.
Hướng tối ưu hóa chiến lược
- Đưa vào cơ chế thích ứng với độ biến động thị trường, điều chỉnh tham số chỉ báo động.
- Thêm bộ lọc thời gian, tránh giao dịch trong khung giờ bất lợi.
- Tối ưu hóa chiến lược chốt lời, có thể cân nhắc sử dụng chốt lời di động (trailing stop).
- Thêm yếu tố chi phí giao dịch, tối ưu hóa điều kiện mở và đóng lệnh.
- Đưa vào cơ chế quản lý vị thế, thực hiện điều chỉnh vị thế linh hoạt.
Tổng kết
Chiến lược này xây dựng một hệ thống giao dịch khá hoàn chỉnh thông qua sự phối hợp của nhiều chỉ báo. Lợi thế cốt lõi nằm ở cơ chế xác nhận tín hiệu đa chiều và hệ thống kiểm soát rủi ro động, nhưng cũng cần chú ý đến vấn đề tối ưu hóa tham số và khả năng thích ứng thị trường. Thông qua việc tối ưu hóa và điều chỉnh liên tục, chiến lược này dự kiến sẽ duy trì hiệu suất ổn định trong các môi trường thị trường khác nhau.
- 1