Tổng quan
Chiến lược này là một hệ thống giao dịch theo dõi xu hướng cao cấp kết hợp với công nghệ trí tuệ nhân tạo, chủ yếu tích hợp VPS (hệ thống giá dao động) và phương pháp xu hướng WOW. Nó sử dụng VPS để xác định sự biến động của thị trường và cường độ xu hướng, đồng thời kết hợp với RSI để phát hiện các điểm đảo ngược giá tiềm năng. Chiến lược này có thể cung cấp tín hiệu nhập cảnh chính xác cho giao dịch hai chiều đa chiều, tăng cường độ chính xác của dự báo thị trường bằng cách sử dụng động lực xu hướng và phân tích xu hướng đồng thời.
Nguyên tắc chiến lược
Chiến lược hoạt động dựa trên ba thành phần cốt lõi:
- Chỉ số xu hướng WOW được sử dụng để xác nhận sự thay đổi xu hướng (từ đa đầu sang không đầu hoặc ngược lại)
- Điều kiện VPS được sử dụng để xác minh sự biến động và cường độ của xu hướng
- RSI phân tích lệch để xác định điểm đảo ngược tiềm năng
Hệ thống đầu tiên tính toán các kênh kháng cự hỗ trợ động dựa trên ATR, kết hợp với tham số chiều dài VPS (bằng mặc định 11) để đánh giá tình trạng thị trường. Khi giá vượt quá mức mua quá mức (78) hoặc mức bán quá mức (27), hệ thống sẽ kích hoạt tín hiệu giao dịch. Đồng thời, chiến lược cũng sẽ giám sát sự lệch giữa giá và chỉ số VPS để xác nhận hướng giao dịch hơn nữa.
Lợi thế chiến lược
- Phân tích đa chiều: cung cấp cái nhìn toàn diện hơn về thị trường bằng cách kết hợp theo dõi xu hướng, biến động và phân tích lệch
- Tự thích ứng: Sử dụng kênh ATR động, có thể tự động điều chỉnh theo biến động của thị trường
- Quản lý rủi ro hoàn hảo: Cơ chế dừng lỗ được xây dựng, có thể tự động thanh toán theo mục tiêu lợi nhuận được đặt trước
- Cơ chế xác nhận tín hiệu: Cần nhiều điều kiện được đáp ứng cùng một lúc để kích hoạt giao dịch, giảm khả năng tín hiệu giả
- Khả năng giao dịch hai chiều: có thể nắm bắt nhiều cơ hội giao dịch hai chiều và tận dụng sự biến động của thị trường
Rủi ro chiến lược
- Tiếng ồn thị trường: có thể tạo ra tín hiệu giả trong môi trường ngang hoặc biến động thấp
- Nhận thức tham số: Cài đặt các tham số chỉ số (ví dụ: độ dài VPS, mức bán tháo) có ảnh hưởng lớn đến hiệu suất chiến lược
- Rủi ro trượt: Trong một chu kỳ ngắn (ví dụ 5 phút) giao dịch, có thể phải đối mặt với ảnh hưởng trượt lớn
- Kéo trễ tín hiệu: Hệ thống xác nhận nhiều lần có thể gây ra sự chậm trễ trong thời gian nhập cảnh
- Quản lý vốn: Phương thức phân bổ vốn cố định có thể hoạt động khác nhau trong các điều kiện thị trường khác nhau
Hướng tối ưu hóa chiến lược
- Điều chỉnh tham số động: Có thể giới thiệu cơ chế tham số thích ứng, điều chỉnh chiều dài VPS và thềm bán tháo theo tình trạng thị trường
- Bộ lọc môi trường thị trường: Thêm mô-đun nhận diện môi trường thị trường, tạm dừng giao dịch trong điều kiện thị trường không phù hợp
- Tối ưu hóa dừng lỗ: có thể thiết kế cơ chế dừng lỗ linh hoạt hơn dựa trên ATR, tăng độ chính xác của kiểm soát rủi ro
- Tối ưu hóa phân đoạn: Điều chỉnh các tham số chiến lược và các quy tắc giao dịch cho các đặc điểm của các giai đoạn giao dịch khác nhau
- Tối ưu hóa quản lý vốn: giới thiệu quản lý vị trí động, điều chỉnh quy mô giao dịch theo biến động thị trường và tình trạng lỗ hổng
Tóm tắt
Đây là một chiến lược giao dịch toàn diện kết hợp nhiều chỉ số kỹ thuật và phương pháp phân tích. Bằng cách kết hợp công nghệ trí tuệ nhân tạo với phân tích kỹ thuật truyền thống, chiến lược có thể cung cấp độ chính xác giao dịch cao trong khi vẫn giữ được sự ổn định. Ưu điểm cốt lõi của chiến lược nằm ở cơ chế xác nhận tín hiệu nhiều tầng và hệ thống quản lý rủi ro được cải thiện, trong khi không gian tối ưu hóa chính nằm trong việc điều chỉnh động của các tham số và nhận diện môi trường thị trường.
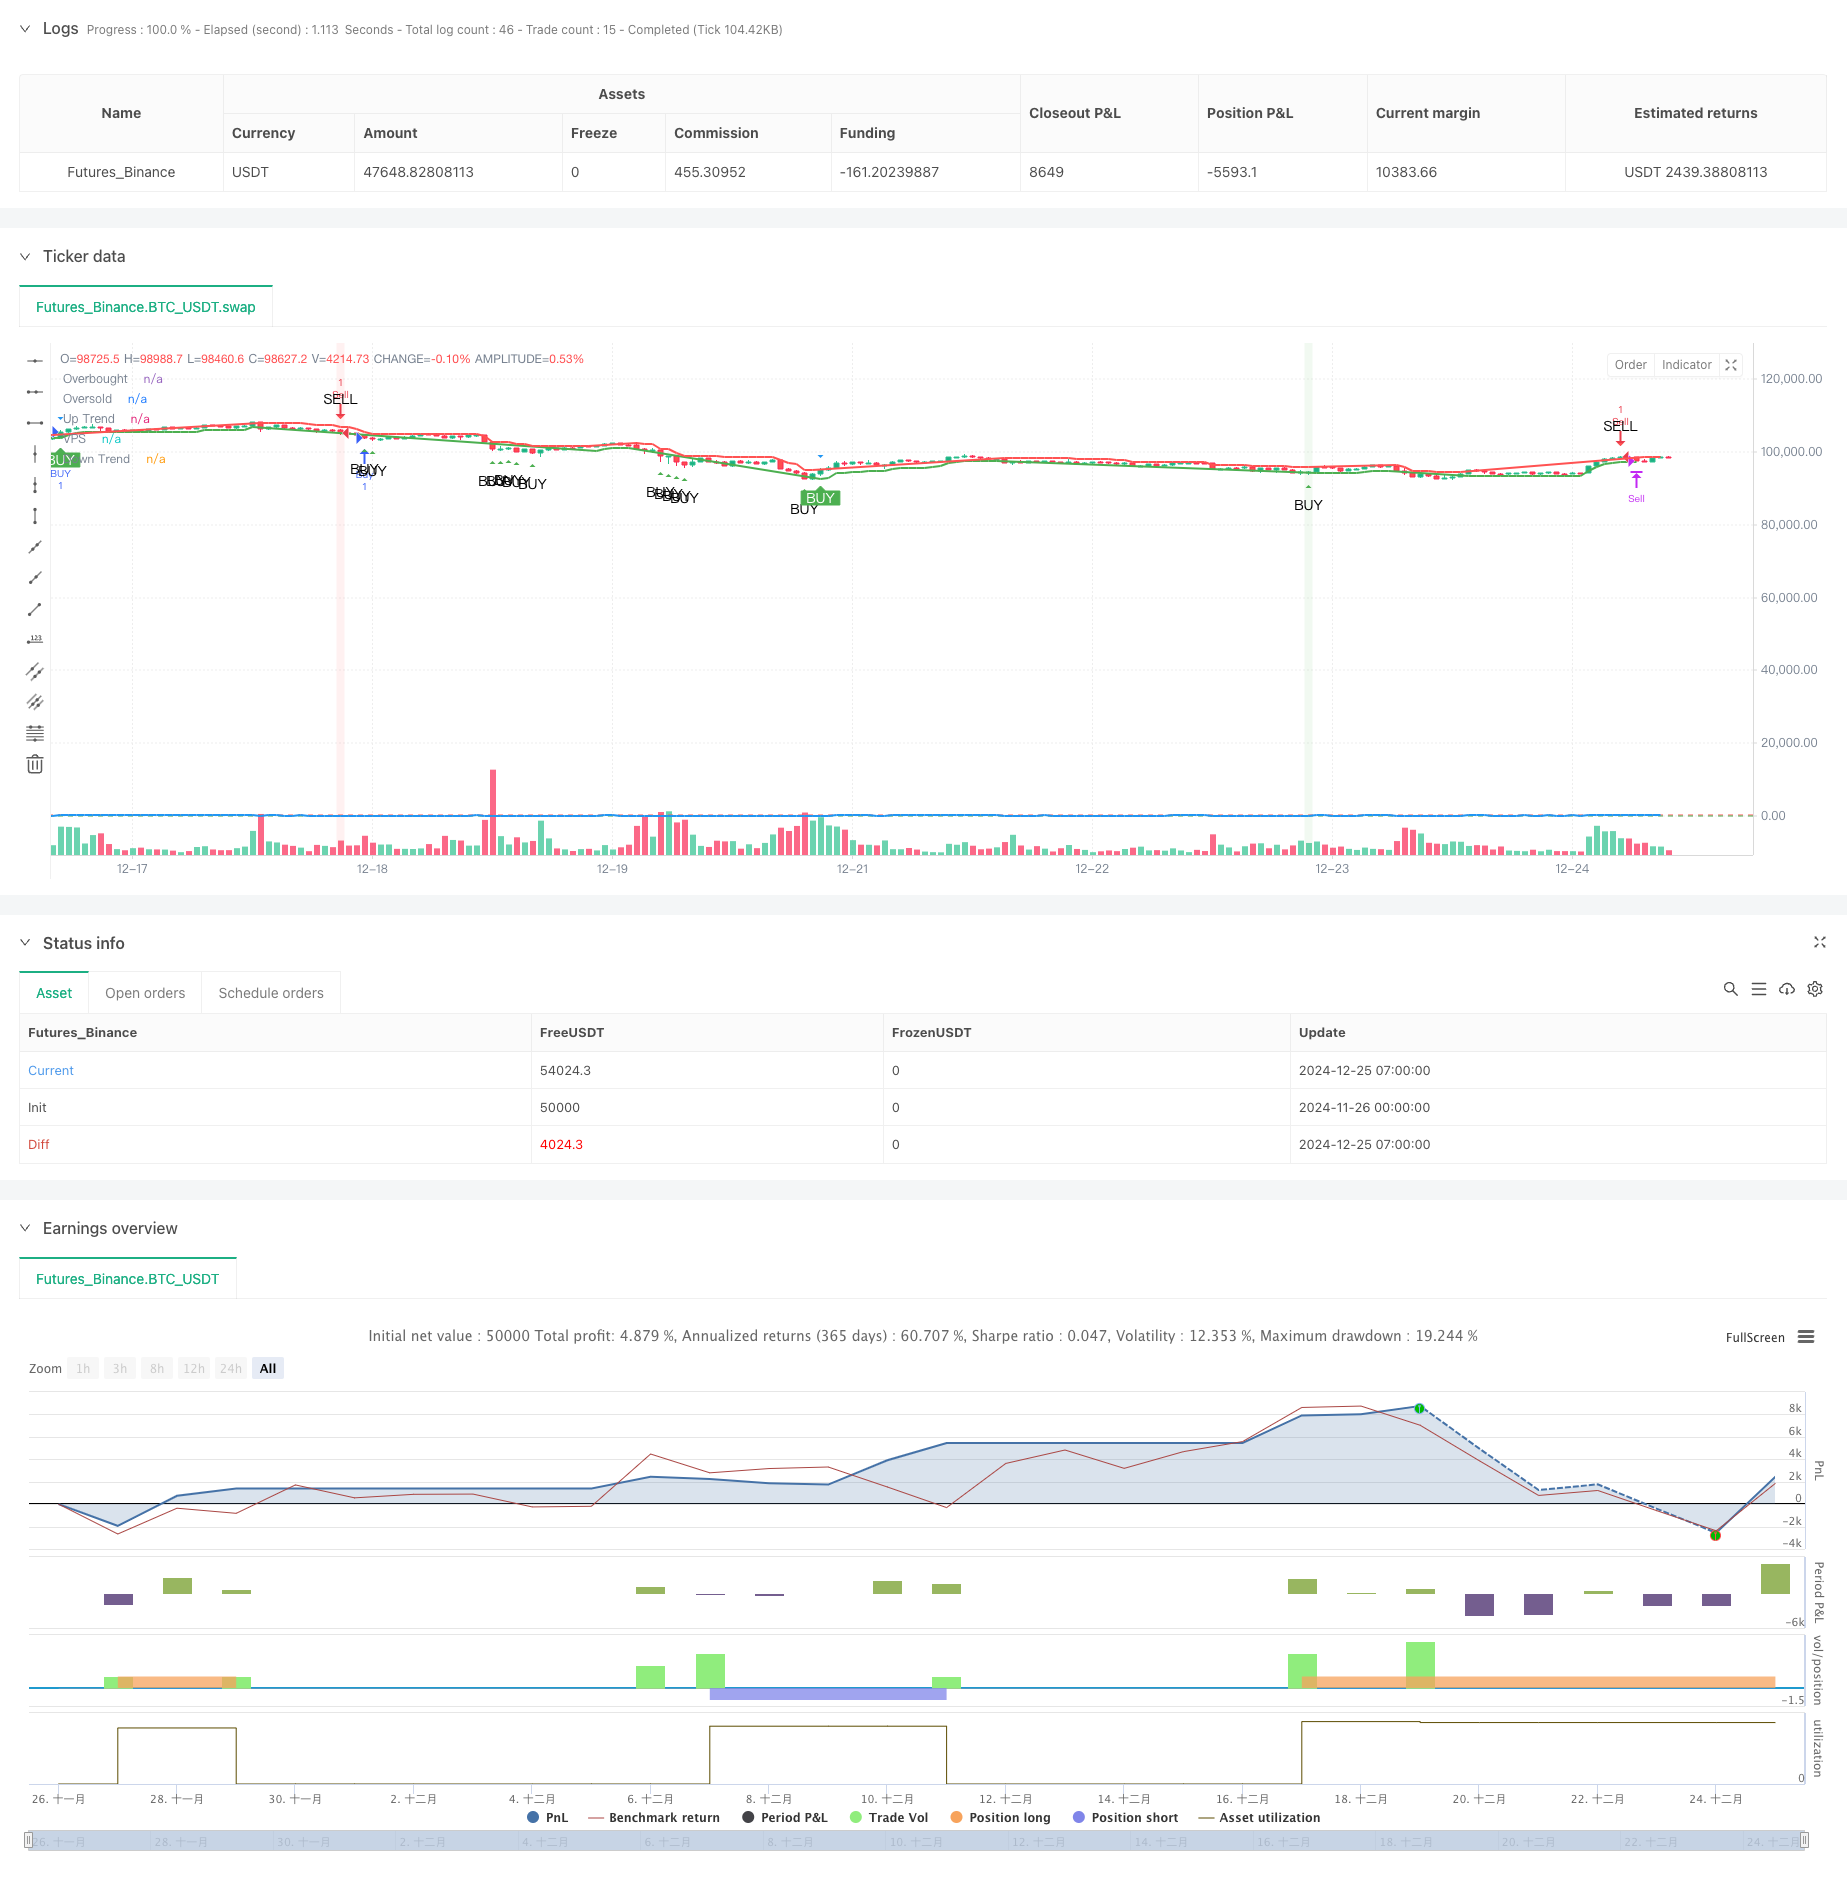
/*backtest
start: 2024-11-26 00:00:00
end: 2024-12-25 08:00:00
period: 1h
basePeriod: 1h
exchanges: [{"eid":"Futures_Binance","currency":"BTC_USDT"}]
*/

//@version=6
strategy("AI+VPS Vijay Prasad Strategy", overlay=true)

// --- VPS Divergence Strategy Inputs ---
vps_length = input.int(11, title="VPS Length")
vps_overbought = input.int(78, title="VPS Overbought Level")  // Overbought level for VPS
vps_oversold = input.int(27, title="VPS Oversold Level")  // Oversold level for VPS

// Calculate VPS (Relative Strength Index alternative) - here using a custom divergence condition
vps = ta.rsi(close, vps_length)

// Plot VPS on the chart
plot(vps, title="VPS", color=color.blue, linewidth=2)
hline(vps_overbought, "Overbought", color=color.red, linewidth=1)
hline(vps_oversold, "Oversold", color=color.green, linewidth=1)

// Define Buy and Sell Conditions based on Overbought/Oversold VPS
vps_buy_condition = vps < vps_oversold  // Buy signal when VPS is oversold
vps_sell_condition = vps > vps_overbought  // Sell signal when VPS is overbought

// Define Bullish and Bearish Divergence conditions
bullish_divergence = (low[1] < low[2] and vps[1] > vps[2] and low < low[1] and vps > vps[1])
bearish_divergence = (high[1] > high[2] and vps[1] < vps[2] and high > high[1] and vps < vps[1])

// Combine Buy and Sell signals:
// Buy when VPS is oversold or Bullish Divergence occurs
vps_buy_condition_final = vps_buy_condition or bullish_divergence
// Sell when VPS is overbought or Bearish Divergence occurs
vps_sell_condition_final = vps_sell_condition or bearish_divergence

// Plot Buy and Sell Signals
plotshape(series=vps_buy_condition_final, title="VPS Buy Signal", location=location.belowbar, color=color.green, style=shape.triangleup, text="BUY")
plotshape(series=vps_sell_condition_final, title="VPS Sell Signal", location=location.abovebar, color=color.red, style=shape.triangledown, text="SELL")

// VPS Divergence Highlight
bgcolor(bullish_divergence ? color.new(color.green, 90) : na)  // Highlight background for Bullish Divergence
bgcolor(bearish_divergence ? color.new(color.red, 90) : na)  // Highlight background for Bearish Divergence

// Strategy: Buy and Sell with target
if vps_buy_condition_final
    strategy.entry("Buy", strategy.long)

if vps_sell_condition_final
    strategy.entry("Sell", strategy.short)

// Capital settings for the strategy (for backtesting purposes)
capital_per_trade = input.float(1000, title="Capital per Trade (INR)", minval=1)
buy_target_inr = 1500  // Profit target for Buy in INR
sell_target_inr = 1000  // Profit target for Sell in INR

trade_value = close * (capital_per_trade / close)  // Value of one contract at current price

// Profit threshold calculation
buy_profit_target = buy_target_inr / trade_value  // Profit in price movement for Buy
sell_profit_target = sell_target_inr / trade_value  // Profit in price movement for Sell

// Exit based on profit targets
if strategy.position_size > 0
    profit_inr = (close - strategy.position_avg_price) * strategy.position_size
    if profit_inr >= buy_target_inr
        strategy.close("Buy", comment="Profit Target Reached")

if strategy.position_size < 0
    profit_inr = (strategy.position_avg_price - close) * -strategy.position_size
    if profit_inr >= sell_target_inr
        strategy.close("Sell", comment="Profit Target Reached")

// --- WoW Trends + VPS (Vijay Prasad Strategy) Logic ---
Periods = input.int(title="ATR Period", defval=10)
src = input.source(close, title="Source")
Multiplier = input.float(title="ATR Multiplier", step=0.1, defval=1.7)
changeATR = input.bool(title="Change ATR Calculation Method ?", defval=true)
showsignals = input.bool(title="Show Buy/Sell Signals ?", defval=true)

// --- ATR Calculation ---
atr2 = ta.sma(ta.tr, Periods)
atr = changeATR ? ta.atr(Periods) : atr2
up = src - (Multiplier * atr)
up1 = na(up[1]) ? up : up[1]
up := close[1] > up1 ? math.max(up, up1) : up
dn = src + (Multiplier * atr)
dn1 = na(dn[1]) ? dn : dn[1]
dn := close[1] < dn1 ? math.min(dn, dn1) : dn

// --- WoW Trends Logic ---
var trend = 1
trend := na(trend[1]) ? 1 : trend
trend := trend == -1 and close > dn1 ? 1 : trend == 1 and close < up1 ? -1 : trend

// --- VPS Logic (Vijay Prasad Strategy) ---
vpsVolatilityCondition = (high - low) > (1.5 * ta.sma(ta.tr, 20))  // VPS condition based on volatility
vpsTrendCondition = trend == 1  // VPS condition to check if trend is up
vpsSignal = vpsVolatilityCondition and vpsTrendCondition  // Combine both VPS conditions

// --- Buy/Sell Signal Logic ---
buySignal = trend == 1 and trend[1] == -1  // Signal to Buy (when trend switches to up)
sellSignal = trend == -1 and trend[1] == 1  // Signal to Sell (when trend switches to down)

// --- Combined Buy/Sell Signal Logic (WoW Trends + VPS) ---
combinedBuySignal = buySignal and vpsSignal
combinedSellSignal = sellSignal and vpsSignal

// --- Plot WoW Trends Lines using plot() ---
plot(trend == 1 ? up : na, title="Up Trend", color=color.green, linewidth=2)
plot(trend == -1 ? dn : na, title="Down Trend", color=color.red, linewidth=2)

// --- Plot VPS Signals ---
plotshape(vpsSignal and showsignals, title="VPS Signal", text="VPS", location=location.abovebar, style=shape.triangledown, size=size.small, color=color.blue, textcolor=color.white)

// --- Plot Combined Buy/Sell Signals ---
plotshape(combinedBuySignal and showsignals, title="Combined Buy Signal", text="BUY", location=location.belowbar, style=shape.labelup, size=size.small, color=color.green, textcolor=color.white)
plotshape(combinedSellSignal and showsignals, title="Combined Sell Signal", text="SELL", location=location.abovebar, style=shape.labeldown, size=size.small, color=color.red, textcolor=color.white)

// --- Strategy Entries ---
if (combinedBuySignal)
    strategy.entry("BUY", strategy.long)

if (combinedSellSignal)
    strategy.entry("SELL", strategy.short)

// --- Highlight Bars for Buy/Sell Signals ---
barcolor(combinedBuySignal ? color.green : na, offset=-1)
barcolor(combinedSellSignal ? color.red : na, offset=-1)