
Tổng quan
Đây là một chiến lược giao dịch trên băng tần cao dựa trên nhiều công cụ kỹ thuật. Chiến lược này tìm kiếm thời điểm đầu vào tốt nhất trong giao dịch ngắn hạn bằng cách kết hợp các tín hiệu thị trường đa chiều như chỉ số di chuyển trung bình (EMA), chỉ số tương đối mạnh (RSI), phân tích khối lượng giao dịch và nhận dạng hình dạng giá chu kỳ N. Chiến lược này sử dụng cơ chế kiểm soát rủi ro nghiêm ngặt để bảo vệ tài chính bằng cách đặt lệnh dừng lỗ.
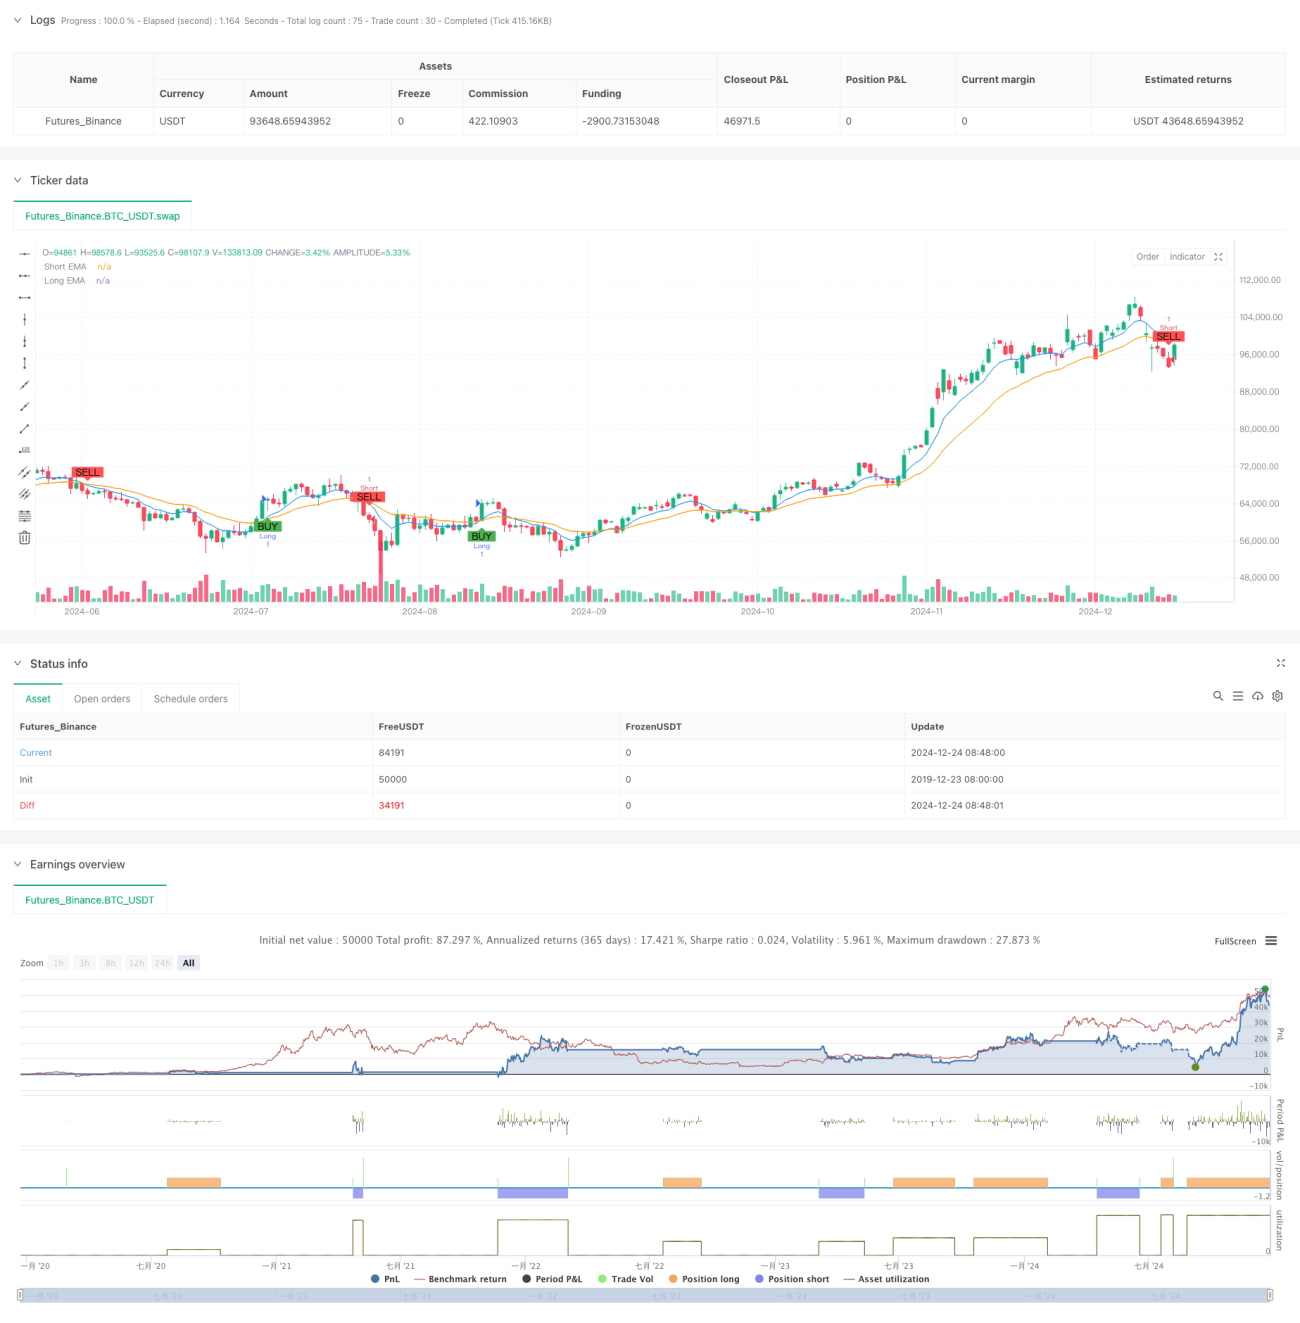
Nguyên tắc chiến lược
Lập luận cốt lõi của chiến lược là xác nhận hướng giao dịch thông qua sự phối hợp phối hợp của các tín hiệu đa chiều:
- Sử dụng giao chéo EMA 8 chu kỳ và 21 chu kỳ để đánh giá hướng xu hướng ngắn hạn
- Bằng 14 chu kỳ RSI xác nhận động lực thị trường, RSI> 50 xác nhận động lực đa đầu, RSI <50 xác nhận động lực trống đầu
- So sánh khối lượng giao dịch hiện tại với khối lượng giao dịch trung bình trong 20 chu kỳ để đảm bảo thị trường hoạt động
- Xác định hình thức đảo ngược tiềm năng bằng cách so sánh 5 đường K gần nhất với các điểm cao nhất và thấp nhất của 10 đường K trước đó
Chỉ khi các tín hiệu trên được đáp ứng cùng một lúc, chiến lược sẽ phát tín hiệu giao dịch. Khi có tín hiệu đa đầu, mở nhiều với giá thị trường, khi có tín hiệu trống, mở rộng với giá thị trường. Đồng thời, thiết lập 1,5% dừng và 0,7% dừng để kiểm soát rủi ro.
Lợi thế chiến lược
- Xác nhận tín hiệu đa chiều làm giảm đáng kể ảnh hưởng của tín hiệu giả
- Kết hợp các lợi thế của theo dõi xu hướng và giao dịch động lực, tăng khả năng thích ứng của chiến lược
- Xác định khối lượng giao dịch để tránh giao dịch trong thời gian thị trường không hoạt động
- Sử dụng nhận dạng hình dạng chu kỳ N để phát hiện các tín hiệu đảo ngược thị trường kịp thời
- Thiết lập tỷ lệ dừng lỗ hợp lý, kiểm soát rủi ro hiệu quả
- Chính sách logic rõ ràng, cho phép tối ưu hóa và điều chỉnh các tham số liên tục
Rủi ro chiến lược
- Có thể thường xuyên kích hoạt dừng lỗ trong thị trường biến động cao
- Cảm giác về sự chậm trễ của các nhà cung cấp
- Khả năng đáp ứng nhiều chỉ số cùng một lúc tương đối ít
- Có thể xảy ra lỗ hổng liên tục trong thị trường chấn động
Biện pháp đối phó:
- Tỷ lệ dừng lỗ có thể được điều chỉnh theo biến động của thị trường
- Khuyến cáo giao dịch trong thời gian có tính thanh khoản tốt hơn
- Có thể cân bằng số lượng và chất lượng tín hiệu bằng cách tối ưu hóa tham số
- Khuyến nghị sử dụng trailing stop để tăng lợi nhuận
Hướng tối ưu hóa chiến lược
- Giới thiệu cơ chế điều chỉnh tham số thích ứng, cho phép chiến lược tự động tối ưu hóa tham số theo tình trạng thị trường
- Tăng bộ lọc biến động thị trường, tạm dừng giao dịch trong môi trường thị trường quá biến động
- Phát triển thuật toán nhận dạng hình dạng chu kỳ N phức tạp hơn để cải thiện độ chính xác của tín hiệu đảo ngược
- Tiến hành mô-đun quản lý tài sản, điều chỉnh quy mô nắm giữ theo động thái giá trị ròng của tài khoản
- Thêm nhiều vòng thời gian xác minh, tăng độ tin cậy tín hiệu
Tóm tắt
Chiến lược này tìm kiếm các cơ hội giao dịch chất lượng trong giao dịch tần số cao bằng cách phối hợp hợp với các chỉ số kỹ thuật đa chiều. Chiến lược được thiết kế để xem xét đầy đủ các đặc điểm của thị trường như xu hướng, động lực, khối lượng giao dịch và đảm bảo sự ổn định thông qua kiểm soát rủi ro nghiêm ngặt. Mặc dù có một số không gian tối ưu hóa, nhưng nói chung là một chiến lược giao dịch logic rõ ràng và thực tế.
- 1