
Tổng quan
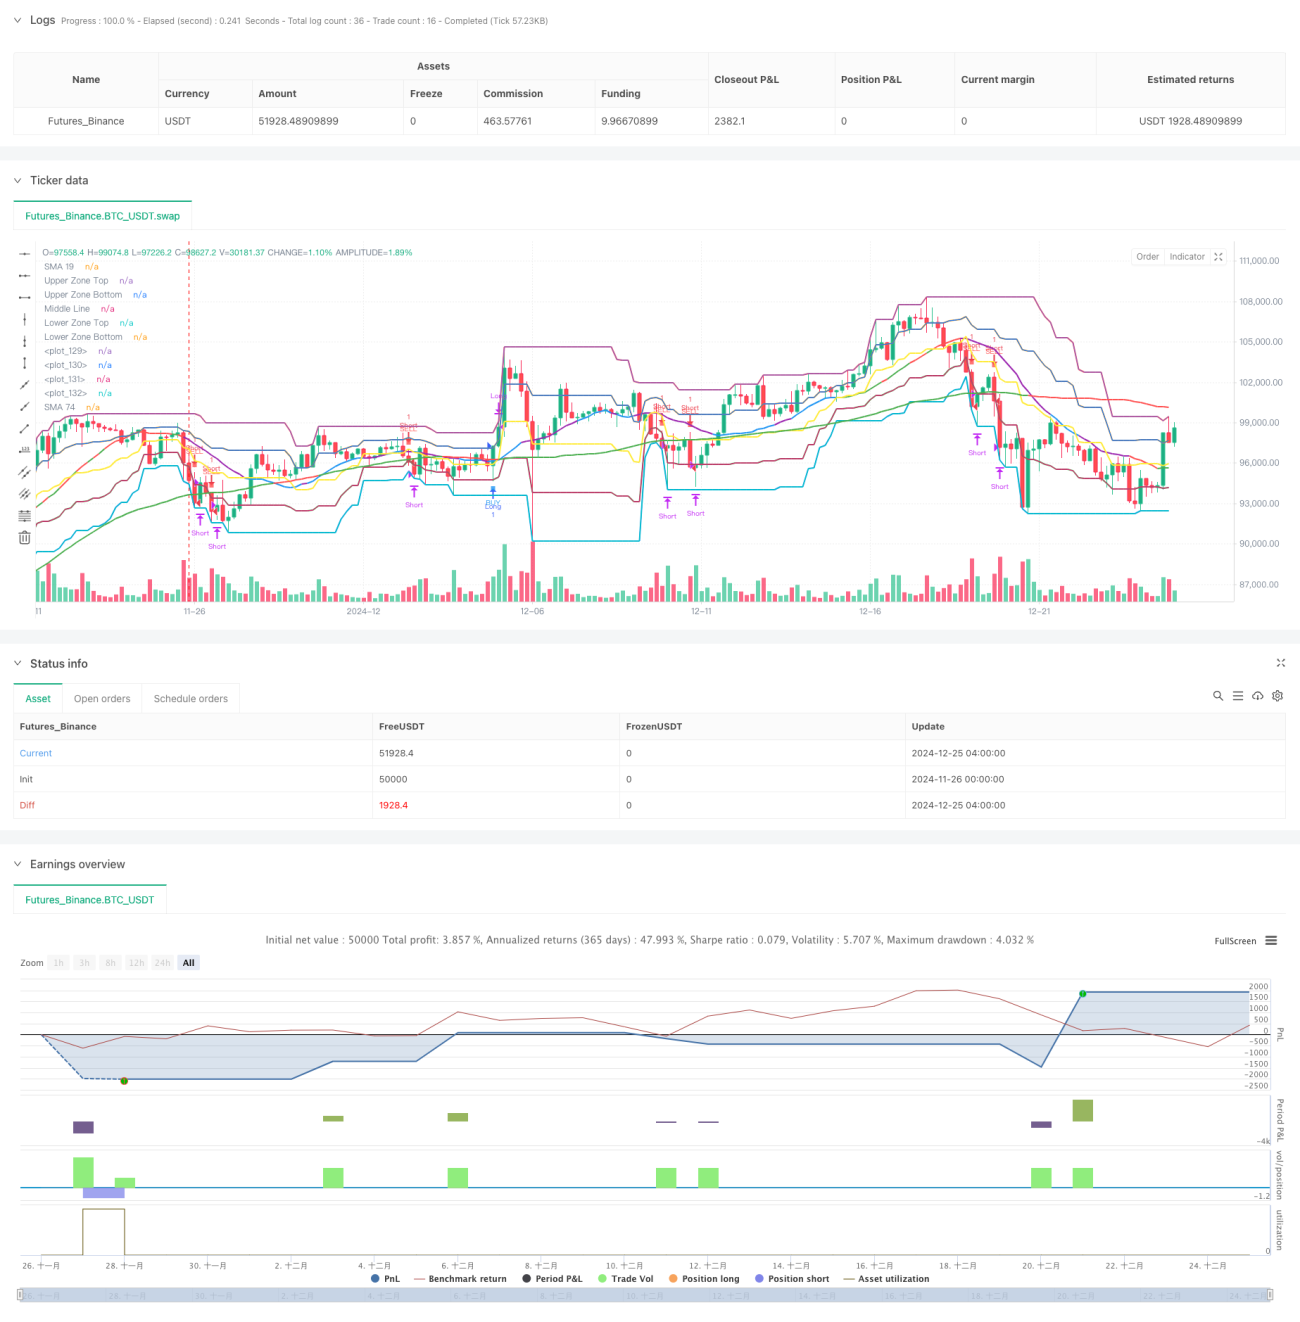
Chiến lược này là một hệ thống giao dịch theo dõi xu hướng kết hợp nhiều đường trung bình di chuyển (SMA) và chỉ số ngẫu nhiên (KDJ). Bằng cách thiết lập phạm vi giá và điều kiện phán đoán xu hướng, giao dịch khi xu hướng thị trường rõ ràng. Chiến lược này sử dụng cơ chế dừng lỗ động, điều chỉnh quản lý vị trí theo xu hướng thị trường, bảo vệ lợi nhuận và không rời khỏi thị trường quá sớm.
Nguyên tắc chiến lược
Chiến lược này dựa trên các thành phần cốt lõi sau:
- Hệ thống đường hai: sử dụng 19 chu kỳ và 74 chu kỳ SMA như một công cụ định hướng
- Phạm vi giá: Phạm vi giá được chia thành 5 cấp để đánh giá sức mạnh của thị trường
- Chỉ số ngẫu nhiên: sử dụng chỉ số ngẫu nhiên 60 chu kỳ để đánh giá quá mua quá bán
- Xác định xu hướng: Xác định tính bền vững của xu hướng bằng cách đi theo 3 đường K liên tiếp
- Điều kiện nhập cảnh: Giá vượt qua SMA chu kỳ 74 và nằm trong phạm vi giá tương ứng
- Cơ chế dừng lỗ: sử dụng theo dõi dừng lỗ, thoát khỏi trận đấu khi xu hướng thay đổi
Lợi thế chiến lược
- Tính toàn vẹn của hệ thống: kết hợp theo dõi xu hướng và chỉ số động lực, cung cấp phân tích thị trường toàn diện
- Quản lý rủi ro: Sử dụng nhiều cơ chế dừng lỗ, bao gồm dừng cứng và dừng theo dõi
- Khả năng thích ứng: có thể thích ứng với các môi trường thị trường khác nhau thông qua điều chỉnh tham số
- Khám phá xu hướng: nắm bắt hiệu quả các xu hướng trung và dài hạn, tránh các tín hiệu sai
- Quản lý Vốn: Điều chỉnh Vốn theo các biến động của thị trường để cải thiện hiệu quả sử dụng vốn
Rủi ro chiến lược
- Rủi ro thị trường biến động: Có thể xảy ra giao dịch thường xuyên trên thị trường ngang
- Rủi ro trượt: Có thể có trượt lớn hơn trong điều kiện nhanh
- Độ nhạy của tham số: Các kết hợp tham số khác nhau có thể dẫn đến sự khác biệt lớn về hiệu suất chiến lược
- Thị trường phụ thuộc vào môi trường: chiến lược hoạt động tốt hơn trong thị trường có xu hướng rõ ràng
- Rủi ro quản lý tài chính: Hoạt động toàn kho có thể mang lại rủi ro rút tiền lớn hơn
Hướng tối ưu hóa chiến lược
- Tiến hành chỉ số biến động: Xem xét thêm chỉ số ATR để điều chỉnh động vị trí dừng lỗ
- Tối ưu hóa thời gian nhập học: có thể tăng xác nhận giao dịch để tăng độ chính xác nhập học
- Tối ưu hóa quản lý vốn: đề xuất thêm mô-đun quản lý vị trí, điều chỉnh vị trí theo động thái rủi ro
- Tăng khả năng đánh giá thị trường: có thể thêm các chỉ số cường độ xu hướng để lọc tín hiệu giao dịch
- Cải thiện cơ chế dừng lỗ: Có thể xem xét sử dụng tỷ lệ theo dõi dừng lỗ để tăng tính linh hoạt
Tóm tắt
Chiến lược này được xây dựng bằng cách kết hợp nhiều chỉ số kỹ thuật để xây dựng một hệ thống giao dịch hoàn chỉnh, có khả năng theo dõi xu hướng tốt và cơ chế quản lý rủi ro. Mặc dù có thể gặp thách thức trong một số môi trường thị trường, chiến lược có khả năng duy trì hiệu suất ổn định trong các môi trường thị trường khác nhau thông qua việc tối ưu hóa và hoàn thiện liên tục.
- 1