Chiến lược xu hướng định lượng đường trung bình động cắt đôi dải Bollinger đám mây

Tổng quan
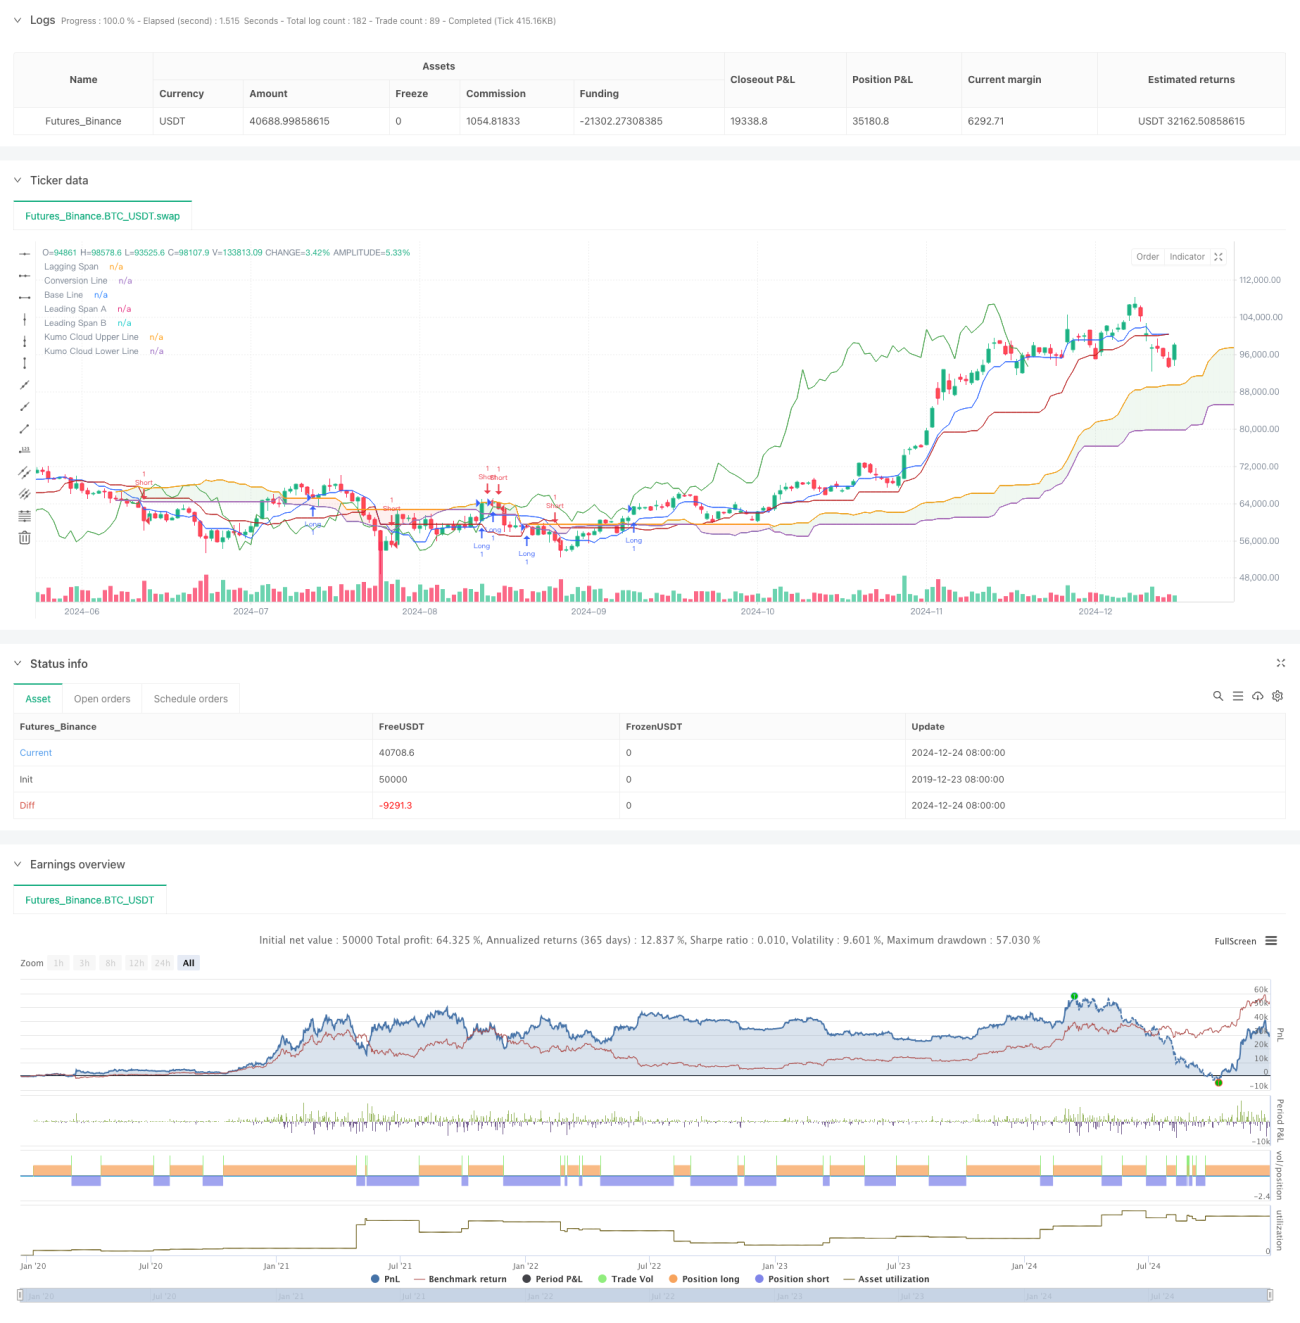
Chiến lược này là hệ thống giao dịch định lượng dựa trên Đám mây Ichimoku. Chiến lược này chủ yếu sử dụng các tín hiệu giao nhau của Đường dẫn A và Đường dẫn B để xác định hướng xu hướng thị trường và tạo ra các tín hiệu giao dịch. Chiến lược này áp dụng phương pháp đánh giá phạm vi giá động, kết hợp với nguyên tắc tính toán của Kênh Donchian, có thể nắm bắt hiệu quả các điểm ngoặt của xu hướng thị trường.
Nguyên tắc chiến lược
Logic cốt lõi của chiến lược này dựa trên các thành phần chính sau:
- Đường chuyển đổi: Sử dụng đường trung bình kênh Donchian 9 chu kỳ làm chỉ báo phản ứng nhanh
- Đường cơ sở: Sử dụng đường trung bình Kênh Donchian 26 kỳ làm chỉ báo xu hướng trung hạn
- Khoảng cách dẫn đầu A: Được tính toán từ mức trung bình của đường chuyển đổi và đường cơ sở
- Khoảng cách dẫn đầu B: Sử dụng đường trung bình Kênh Donchian 52 kỳ làm chỉ báo xu hướng dài hạn
- Khoảng trễ: Di chuyển giá đóng cửa trở lại 26 kỳ
Các điều kiện kích hoạt tín hiệu giao dịch như sau:
- Tín hiệu dài: Khi dải dẫn đầu A cắt dải dẫn đầu B hướng lên trên
- Tín hiệu ngắn: Khi dải dẫn đầu A cắt dải dẫn đầu B xuống phía dưới
Lợi thế chiến lược
- Xác nhận xu hướng đa chiều: Thông qua sự kết hợp của các chỉ số của các giai đoạn khác nhau, xu hướng thị trường có thể được đánh giá toàn diện
- Độ tin cậy tín hiệu cao: Sử dụng mây vượt qua làm điều kiện kích hoạt tín hiệu có thể lọc hiệu quả các tín hiệu sai
- Kiểm soát rủi ro hoàn hảo: Bản thân cấu trúc đám mây có chức năng hỗ trợ áp lực, cung cấp vị thế dừng lỗ tự nhiên cho giao dịch
- Khả năng thích ứng mạnh mẽ: Các thông số chiến lược có thể được điều chỉnh theo các đặc điểm khác nhau của thị trường, có tính phổ biến mạnh mẽ
Rủi ro chiến lược
- Rủi ro độ trễ: Do sử dụng phương pháp tính toán chu kỳ dài hơn nên có thể có độ trễ nhất định trong các tín hiệu vào và ra.
- Rủi ro thị trường biến động: Trong thị trường đi ngang và biến động, tín hiệu đột phá sai thường xuyên có thể xảy ra
- Độ nhạy của tham số: Các kết hợp tham số khác nhau có thể dẫn đến sự khác biệt lớn về hiệu suất chiến lược
- Rủi ro sụt giảm: Khi xu hướng đảo ngược, bạn có thể phải đối mặt với mức sụt giảm lớn hơn
Hướng tối ưu hóa chiến lược
- Giới thiệu các chỉ báo khối lượng: Tính hợp lệ của xu hướng có thể được xác nhận bằng cách kết hợp các thay đổi về khối lượng
- Tối ưu hóa lựa chọn tham số: điều chỉnh linh hoạt các tham số khác nhau theo đặc điểm của các chu kỳ thị trường khác nhau
- Thêm các chỉ báo phụ trợ: Bạn có thể thêm các chỉ báo như RSI hoặc MACD làm tín hiệu xác nhận phụ trợ
- Cải thiện cơ chế dừng lỗ: thiết kế các chiến lược dừng lỗ linh hoạt hơn, chẳng hạn như dừng lỗ theo sau
Tóm tắt
Chiến lược này là một hệ thống giao dịch định lượng kết hợp các công cụ phân tích kỹ thuật cổ điển để nắm bắt cơ hội thị trường thông qua phân tích xu hướng đa chiều. Mặc dù có độ trễ nhất định nhưng nhìn chung nó có độ tin cậy và khả năng thích ứng tốt. Thông qua quá trình tối ưu hóa và cải tiến liên tục, chiến lược này dự kiến sẽ duy trì hiệu suất ổn định trong nhiều môi trường thị trường khác nhau.
/*backtest
start: 2019-12-23 08:00:00
end: 2024-12-25 08:00:00
period: 1d
basePeriod: 1d
exchanges: [{"eid":"Futures_Binance","currency":"BTC_USDT"}]
*/

// This Pine Script™ code is subject to the terms of the Mozilla Public License 2.0 at https://mozilla.org/MPL/2.0/
// © mrbakipinarli

//@version=6- 1