
Tổng quan
Chiến lược này là chiến lược giao dịch tần suất cao dựa trên khung thời gian 15 phút. Chiến lược này kết hợp nhiều chỉ báo kỹ thuật, bao gồm đường trung bình động hàm mũ (EMA), chỉ số sức mạnh tương đối (RSI), chỉ số định hướng trung bình (ADX) và phạm vi thực trung bình (ATR) để đạt được tín hiệu giao dịch thông qua sự kết hợp của các chỉ báo này. Nắm bắt chính xác và quản lý rủi ro một cách năng động. Chiến lược này sử dụng thiết kế trực quan rõ ràng, giúp các nhà giao dịch dễ dàng theo dõi tình hình thị trường và tín hiệu giao dịch theo thời gian thực.
Nguyên tắc chiến lược
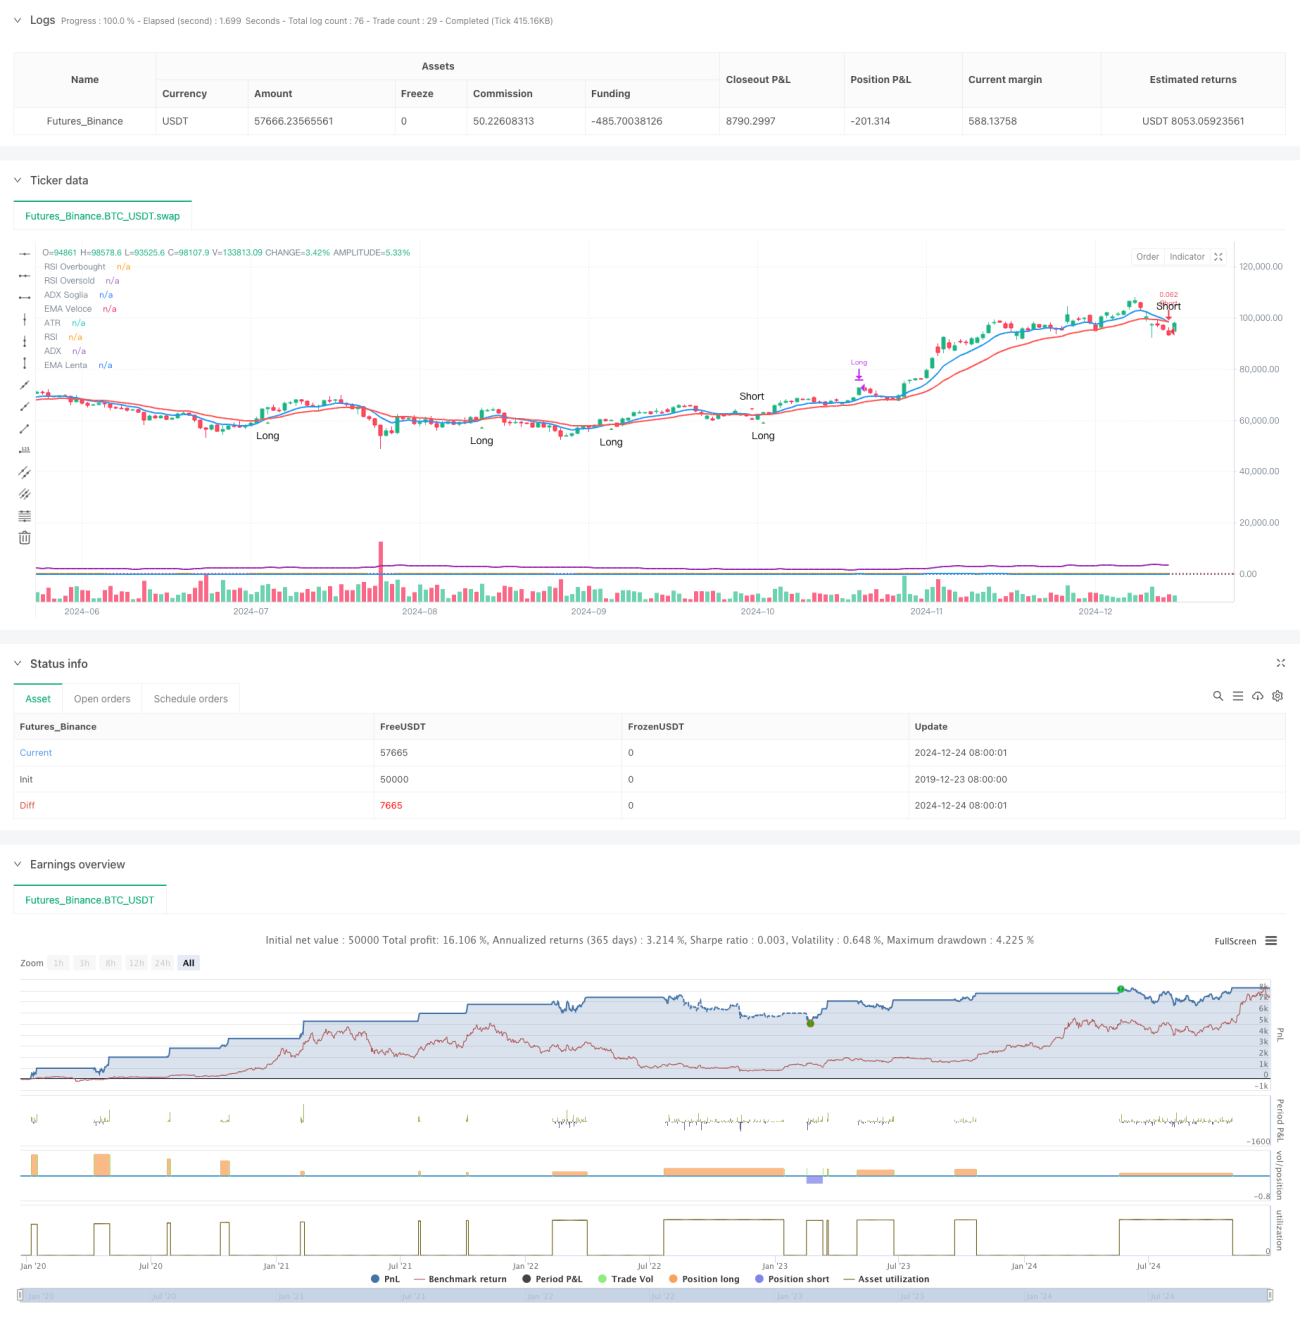
Logic cốt lõi của chiến lược này là tạo ra các tín hiệu giao dịch dựa trên sự giao nhau giữa đường EMA nhanh (9 kỳ) và đường EMA chậm (21 kỳ). RSI (14 kỳ) được sử dụng để lọc các vùng quá bán, ADX (14 kỳ) được sử dụng để xác nhận sức mạnh của xu hướng và ATR (14 kỳ) được sử dụng để thiết lập mục tiêu dừng lỗ và lợi nhuận một cách linh hoạt. Sự kết hợp của nhiều chỉ báo kỹ thuật đảm bảo độ tin cậy của tín hiệu giao dịch. Điều kiện vào lệnh bao gồm: dài hạn – đường EMA nhanh cắt lên trên đường EMA chậm và RSI dưới 70, ADX trên 20; ngắn hạn – đường EMA nhanh cắt xuống dưới đường EMA chậm và RSI trên 30, ADX trên 20. Exit sử dụng cài đặt mục tiêu lợi nhuận và dừng lỗ động dựa trên ATR.
Lợi thế chiến lược
- Độ tin cậy tín hiệu cao: Xác thực chéo nhiều chỉ báo kỹ thuật cải thiện đáng kể độ chính xác của tín hiệu giao dịch
- Quản lý rủi ro linh hoạt: Cài đặt mục tiêu dừng lỗ và lợi nhuận động dựa trên ATR, có thể tự động điều chỉnh theo biến động của thị trường
- Nhiều cơ hội giao dịch: Khung thời gian 15 phút cung cấp nhiều cơ hội giao dịch
- Mức độ trực quan cao: Bố cục sơ đồ rõ ràng và hiển thị tín hiệu giúp đưa ra quyết định nhanh chóng
- Mức độ tự động hóa cao: Hệ thống tín hiệu hoàn chỉnh hỗ trợ thực hiện giao dịch tự động
Rủi ro chiến lược
- Rủi ro biến động thị trường: Giao dịch tần suất cao có thể phải đối mặt với rủi ro trượt giá trong thị trường biến động
- Rủi ro đột phá sai: Các chu kỳ ngắn hạn có thể tạo ra các tín hiệu sai, cần được lọc bởi ADX
- Rủi ro quản lý quỹ: Giao dịch thường xuyên có thể dẫn đến tích lũy phí xử lý, do đó bạn cần kiểm soát các vị thế của mình một cách hợp lý
- Rủi ro kỹ thuật: Nhiều chỉ báo có thể tạo ra các tín hiệu xung đột trong một số điều kiện thị trường nhất định
- Rủi ro thực hiện: Hệ thống giao dịch tự động yêu cầu môi trường mạng ổn định và điều kiện thực hiện
Hướng tối ưu hóa chiến lược
- Tối ưu hóa tham số chỉ báo: Bạn có thể tối ưu hóa các tham số của từng chỉ báo thông qua kiểm tra ngược để làm cho nó phù hợp hơn với các điều kiện thị trường cụ thể
- Cải tiến lọc tín hiệu: Có thể thêm chỉ báo âm lượng làm điều kiện lọc phụ trợ
- Kiểm soát rủi ro được cải thiện: Có thể đưa vào hệ thống quản lý vị thế động để điều chỉnh quy mô giao dịch theo biến động của thị trường
- Tối ưu hóa cửa sổ thời gian: Cửa sổ thời gian giao dịch có thể được điều chỉnh linh hoạt theo các giai đoạn thị trường khác nhau
- Tối ưu hóa chiến lược dừng lỗ: Có thể giới thiệu cơ chế dừng lỗ theo sau để cải thiện khả năng bảo vệ mức lợi nhuận
Tóm tắt
Chiến lược này đạt được sự cân bằng giữa việc nắm bắt tín hiệu và kiểm soát rủi ro trong giao dịch tần suất cao thông qua sự kết hợp của nhiều chỉ báo kỹ thuật. Thiết kế trực quan rõ ràng và hỗ trợ tự động hóa hoàn toàn giúp ứng dụng thực tế hơn. Thông qua việc liên tục tối ưu hóa và cải thiện quản lý rủi ro, chiến lược này được kỳ vọng sẽ duy trì hiệu suất ổn định trong các môi trường thị trường khác nhau. Mặc dù có một số rủi ro nhất định, nhưng những rủi ro này có thể kiểm soát được thông qua việc thiết lập thông số hợp lý và các biện pháp kiểm soát rủi ro. Để vận hành thành công chiến lược này, các nhà giao dịch phải hiểu sâu sắc về thị trường và luôn tập trung vào rủi ro.
/*backtest
start: 2019-12-23 08:00:00
end: 2024-12-25 08:00:00
period: 1d
basePeriod: 1d
exchanges: [{"eid":"Futures_Binance","currency":"BTC_USDT"}]
*/

//@version=5
strategy("Scalping BTC Ottimizzato - Grafica Chiara", shorttitle="Scalp BTC Opt", overlay=true, default_qty_type=strategy.percent_of_equity, default_qty_value=10)

// === 📊 INPUTS ===- 1