
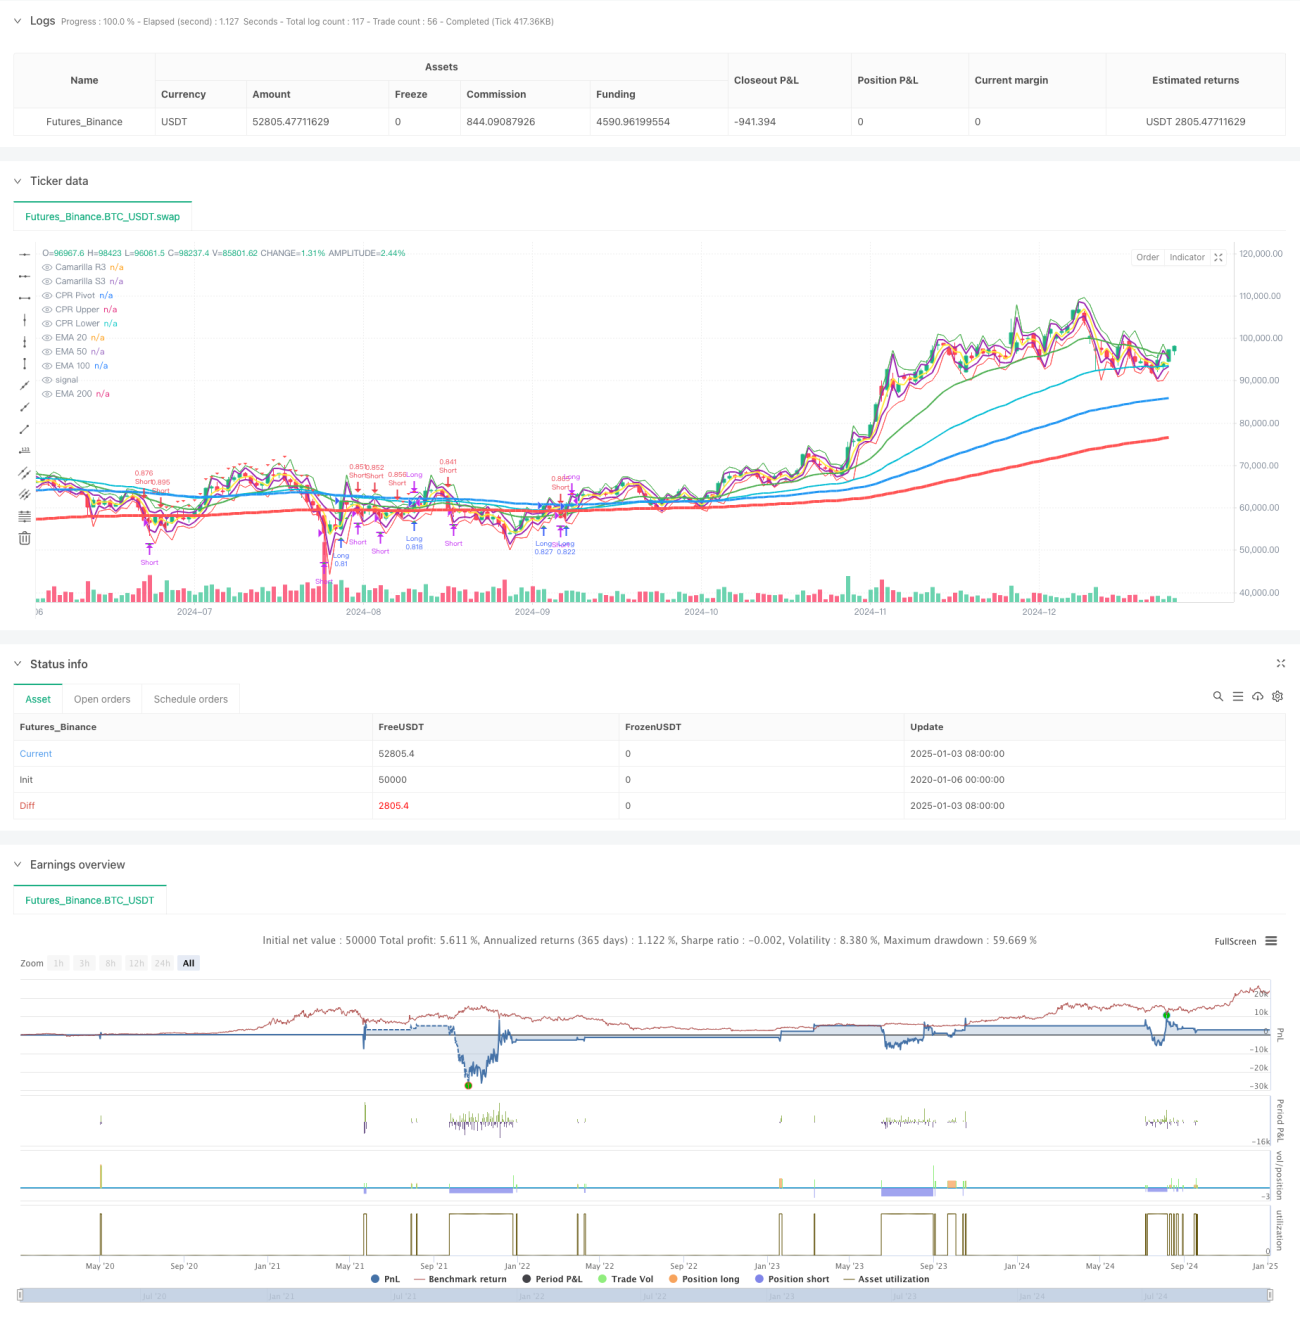
Chiến lược này là một hệ thống giao dịch theo xu hướng kết hợp nhiều đường trung bình động hàm mũ (EMA), mức hỗ trợ và kháng cự Camarilla và Khoảng trục trung tâm (CPR). Chiến lược này xác định xu hướng thị trường và cơ hội giao dịch tiềm năng bằng cách phân tích giá liên quan đến nhiều đường trung bình động và phạm vi giá quan trọng. Hệ thống áp dụng các biện pháp quản lý quỹ và kiểm soát rủi ro chặt chẽ, bao gồm tỷ lệ phần trăm quy mô vị thế và cơ chế thoát lệnh đa dạng.
Chiến lược này dựa trên các thành phần cốt lõi sau:
Chiến lược này xây dựng một hệ thống giao dịch hoàn chỉnh bằng cách tích hợp nhiều công cụ phân tích kỹ thuật cổ điển. Ưu điểm của hệ thống nằm ở khả năng phân tích thị trường đa chiều và quản lý rủi ro chặt chẽ, nhưng cũng cần chú ý đến khả năng thích ứng với các môi trường thị trường khác nhau. Thông qua việc tối ưu hóa và cải tiến liên tục, chiến lược này dự kiến sẽ cải thiện lợi nhuận trong khi vẫn duy trì tính ổn định.
/*backtest
start: 2020-01-06 00:00:00
end: 2025-01-04 08:00:00
period: 1d
basePeriod: 1d
exchanges: [{"eid":"Futures_Binance","currency":"BTC_USDT"}]
*/
//@version=5
strategy("Pradeep Crude oil Entry and Exit", overlay=true)
// Input settings for EMAs
ema20_period = input.int(20, title="EMA 20 Period")
ema50_period = input.int(50, title="EMA 50 Period")
ema100_period = input.int(100, title="EMA 100 Period")
ema200_period = input.int(200, title="EMA 200 Period")
// Fixed line width settings for EMAs
ema20_width = 2 // EMA 20 Line Width
ema50_width = 2 // EMA 50 Line Width
ema100_width = 3 // EMA 100 Line Width
ema200_width = 4 // EMA 200 Line Width
// Backtesting inputs
initial_capital = input.float(50000, title="Initial Capital", minval=100)
position_size_percent = input.float(100, title="Position Size (% of Capital)", minval=0.1, maxval=100)
exit_mode = input.string("Price Movement", title="Exit Mode", options=["Price Movement", "Percentage Movement"])
exit_points = input.int(20, title="Exit After X Points", minval=1)
exit_percentage = input.float(1.0, title="Exit After X% Movement", minval=0.1, step=0.1)
// Calculate EMAs
ema20 = ta.ema(close, ema20_period)
ema50 = ta.ema(close, ema50_period)
ema100 = ta.ema(close, ema100_period)
ema200 = ta.ema(close, ema200_period)
// Signal conditions
long_entry_condition = close > ema200 and close > ema20 and close[1] <= ema200
long_exit_condition = (exit_mode == "Price Movement" and close - strategy.position_avg_price >= exit_points * syminfo.mintick) or
(exit_mode == "Percentage Movement" and (close - strategy.position_avg_price) / strategy.position_avg_price * 100 >= exit_percentage)
short_entry_condition = close < ema200 and close < ema20 and close[1] >= ema200
short_exit_condition = (exit_mode == "Price Movement" and strategy.position_avg_price - close >= exit_points * syminfo.mintick) or
(exit_mode == "Percentage Movement" and (strategy.position_avg_price - close) / strategy.position_avg_price * 100 >= exit_percentage)
// Plot EMAs with specified line widths
plot(ema20, color=color.green, title="EMA 20", linewidth=ema20_width)
plot(ema50, color=color.aqua, title="EMA 50", linewidth=ema50_width)
plot(ema100, color=color.blue, title="EMA 100", linewidth=ema100_width)
plot(ema200, color=color.red, title="EMA 200", linewidth=ema200_width)
// Camarilla Pivot Calculation
prev_high = request.security(syminfo.tickerid, "D", high[1])
prev_low = request.security(syminfo.tickerid, "D", low[1])
prev_close = request.security(syminfo.tickerid, "D", close[1])
R3 = prev_close + (prev_high - prev_low) * 1.1 / 2
S3 = prev_close - (prev_high - prev_low) * 1.1 / 2
// Central Pivot Range (CPR) Calculation
pivot = (prev_high + prev_low + prev_close) / 3
upper_cpr = pivot + (prev_high - prev_low)
lower_cpr = pivot - (prev_high - prev_low)
// Plot Camarilla R3, S3 and CPR levels
plot(R3, color=color.purple, title="Camarilla R3", linewidth=2)
plot(S3, color=color.purple, title="Camarilla S3", linewidth=2)
plot(pivot, color=color.yellow, title="CPR Pivot", linewidth=2)
plot(upper_cpr, color=color.green, title="CPR Upper", linewidth=1)
plot(lower_cpr, color=color.red, title="CPR Lower", linewidth=1)
// Backtesting: Capital and position size
capital = initial_capital
risk_per_trade = (position_size_percent / 100) * capital
// Long positions
if long_entry_condition
strategy.entry("Long", strategy.long, qty=risk_per_trade / close)
// Display entry price label
label.new(bar_index, close, text="Entry: " + str.tostring(close), color=color.green, style=label.style_label_up, yloc=yloc.belowbar)
if long_exit_condition
strategy.close("Long")
// Display exit price label
label.new(bar_index, close, text="Exit: " + str.tostring(close), color=color.red, style=label.style_label_down, yloc=yloc.abovebar)
// Short positions
if short_entry_condition
strategy.entry("Short", strategy.short, qty=risk_per_trade / close)
// Display entry price label
label.new(bar_index, close, text="Entry: " + str.tostring(close), color=color.red, style=label.style_label_down, yloc=yloc.abovebar)
if short_exit_condition
strategy.close("Short")
// Display exit price label
label.new(bar_index, close, text="Exit: " + str.tostring(close), color=color.green, style=label.style_label_up, yloc=yloc.belowbar)
// Plot signals
plotshape(long_entry_condition, style=shape.triangleup, location=location.belowbar, color=color.new(color.green, 0), size=size.small, title="Long Entry")
plotshape(long_exit_condition, style=shape.triangledown, location=location.abovebar, color=color.new(color.red, 0), size=size.small, title="Long Exit")
plotshape(short_entry_condition, style=shape.triangledown, location=location.abovebar, color=color.new(color.red, 0), size=size.small, title="Short Entry")
plotshape(short_exit_condition, style=shape.triangleup, location=location.belowbar, color=color.new(color.green, 0), size=size.small, title="Short Exit")