
Tổng quan
Chiến lược này là một hệ thống theo dõi xu hướng thích ứng dựa trên việc lọc nhiều chỉ báo kỹ thuật. Nó kết hợp nhiều chỉ báo kỹ thuật như đường trung bình động hàm mũ (EMA), đường trung bình động đơn giản (SMA) và đường trung bình động hội tụ phân kỳ (MACD), và điều chỉnh các thông số một cách linh hoạt để thích ứng với các môi trường thị trường khác nhau nhằm nắm bắt xu hướng hiệu quả và kiểm soát rủi ro. Chiến lược này áp dụng cơ chế lọc theo lớp và cải thiện đáng kể độ tin cậy của tín hiệu giao dịch thông qua sự phối hợp của nhiều chỉ báo kỹ thuật.
Nguyên tắc chiến lược
Logic cốt lõi của chiến lược này dựa trên cơ chế lọc ba lớp:
- Lớp nhận dạng xu hướng thích ứng: Sử dụng kết hợp các đường EMA nhanh và chậm để tính toán đường cơ sở xu hướng và điều chỉnh linh hoạt các đường theo dõi trên và dưới dựa trên sự biến động của thị trường.
- Bộ lọc SMA: Sử dụng đường trung bình động đơn giản để đảm bảo hướng chuyển động của giá phù hợp với xu hướng chung.
- Lớp xác nhận MACD: Sử dụng chức năng xác nhận xu hướng của chỉ báo MACD để xác minh thêm tính hợp lệ của tín hiệu giao dịch.
Việc tạo ra tín hiệu giao dịch đòi hỏi phải đáp ứng tất cả các điều kiện lọc: thay đổi xu hướng, xác nhận hướng SMA và hỗ trợ đường tín hiệu MACD. Chiến lược này cũng bao gồm hệ thống quản lý vị thế năng động dựa trên vốn chủ sở hữu tài khoản, tự động điều chỉnh quy mô vị thế thông qua các yếu tố đòn bẩy.
Lợi thế chiến lược
- Khả năng thích ứng mạnh mẽ: Bằng cách điều chỉnh các thông số một cách linh hoạt, chiến lược có thể thích ứng với các môi trường thị trường khác nhau.
- Kiểm soát rủi ro hoàn hảo: Nhiều cơ chế lọc giúp giảm đáng kể khả năng xuất hiện tín hiệu sai.
- Khả năng tùy chỉnh cao: Người dùng có thể điều chỉnh nhiều thông số khác nhau theo phong cách giao dịch cá nhân của mình.
- Mức độ tự động hóa cao: Hỗ trợ tin nhắn cảnh báo ở định dạng JSON, giúp dễ dàng kết nối với các hệ thống giao dịch tự động.
- Hiệu ứng trực quan tốt: cung cấp phản hồi trực quan phong phú, bao gồm các dải xu hướng, điểm đánh dấu tín hiệu, v.v.
Rủi ro chiến lược
- Phụ thuộc vào xu hướng: Tín hiệu sai thường xuyên có thể được tạo ra trong một thị trường biến động.
- Rủi ro trễ: Nhiều cơ chế lọc có thể dẫn đến thời gian nhập cảnh bị chậm trễ.
- Độ nhạy của tham số: Các kết hợp tham số khác nhau có thể dẫn đến sự khác biệt lớn về hiệu suất chiến lược.
- Rủi ro đòn bẩy: Đòn bẩy quá mức có thể làm tăng tổn thất.
Hướng tối ưu hóa chiến lược
- Thích ứng với biến động: Thêm cơ chế dừng lỗ động dựa trên ATR.
- Xác định môi trường thị trường: Thêm hệ thống phân loại trạng thái thị trường và sử dụng các kết hợp tham số khác nhau trong các môi trường thị trường khác nhau.
- Đánh giá chất lượng tín hiệu: Thiết lập hệ thống đánh giá cường độ tín hiệu và điều chỉnh vị trí một cách linh hoạt dựa trên cường độ tín hiệu.
- Tối ưu hóa quản lý quỹ: Giới thiệu các thuật toán quản lý quỹ phức tạp hơn để kiểm soát vị thế tốt hơn.
Tóm tắt
Chiến lược này đạt được hiệu quả theo dõi xu hướng đáng tin cậy hơn thông qua cơ chế lọc nhiều lớp và điều chỉnh tham số động. Mặc dù có một số rủi ro về độ trễ và phụ thuộc vào tham số, hiệu suất ổn định vẫn có thể đạt được trong các giao dịch thực tế thông qua các biện pháp tối ưu hóa tham số và kiểm soát rủi ro hợp lý. Nhà giao dịch được khuyến nghị nên tiến hành kiểm tra ngược đầy đủ trước khi sử dụng theo thời gian thực và điều chỉnh cài đặt thông số theo khả năng chịu rủi ro cá nhân của họ.
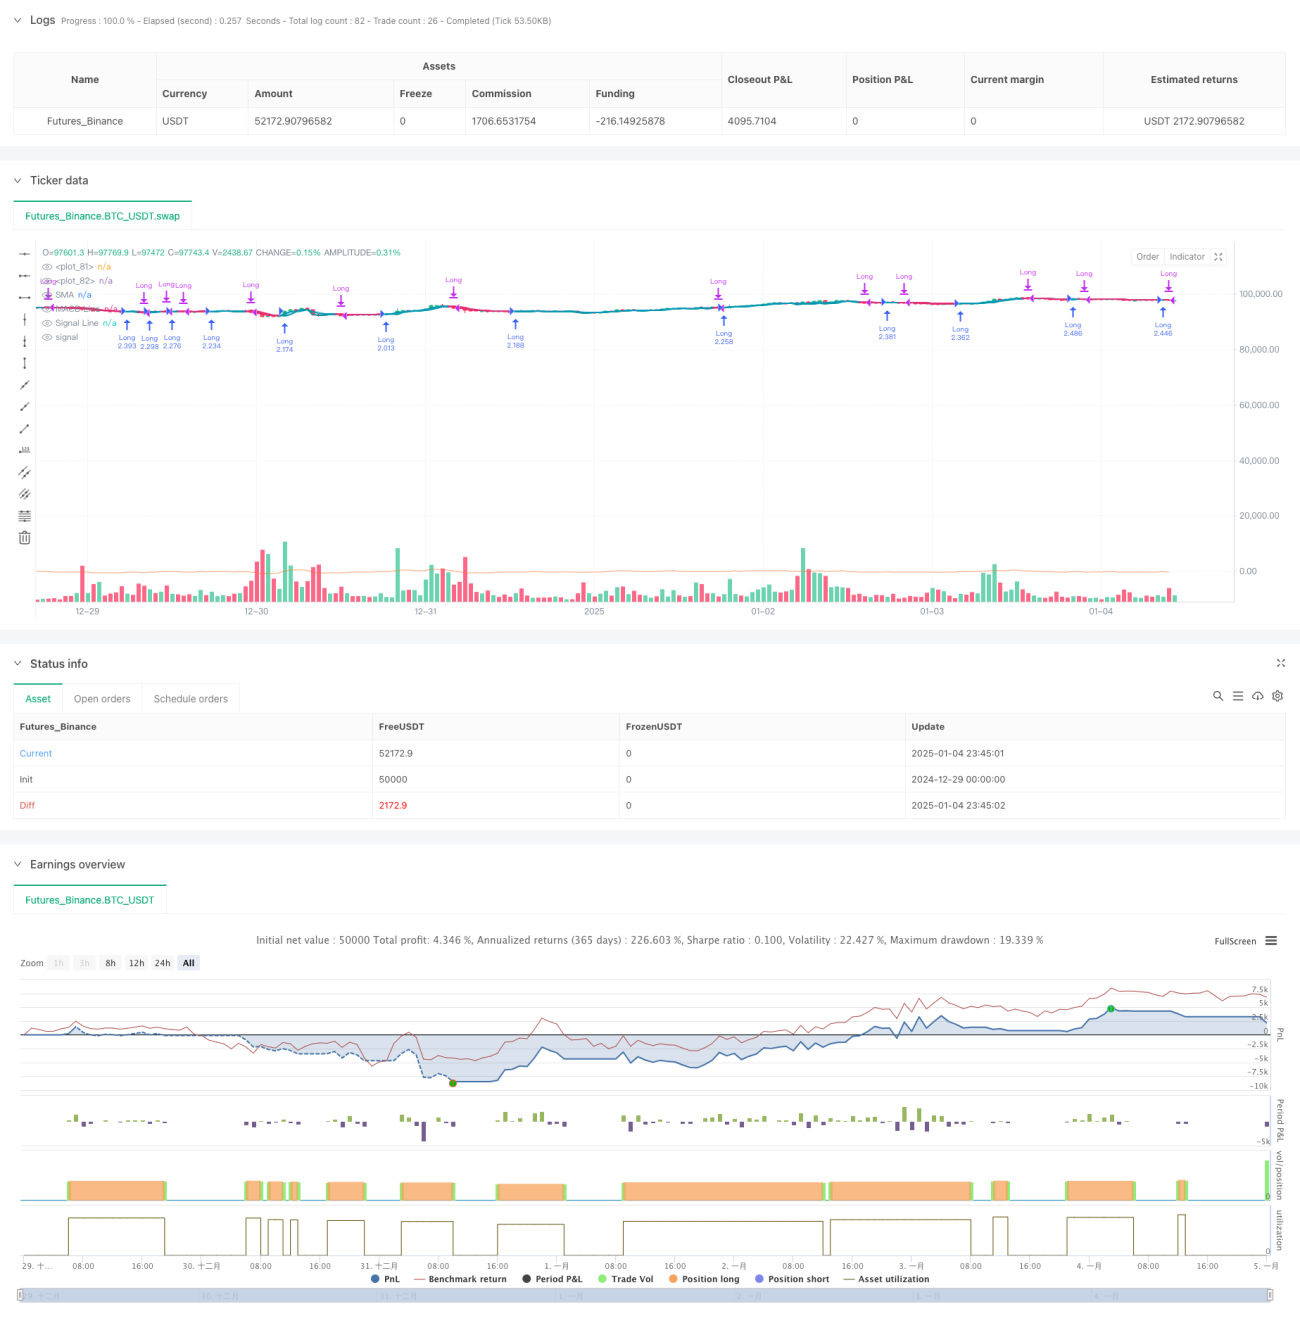
/*backtest
start: 2024-12-29 00:00:00
end: 2025-01-05 00:00:00
period: 45m
basePeriod: 45m
exchanges: [{"eid":"Futures_Binance","currency":"BTC_USDT"}]
*/

//@version=6
strategy("Adaptive Trend Flow Strategy with Filters for SPX", overlay=true, max_labels_count=500,
     initial_capital=1000, commission_type=strategy.commission.cash_per_order, commission_value=0.01, slippage=2,
margin_long=20, margin_short=20, default_qty_type=strategy.percent_of_equity, default_qty_value=100)- 1