
Tổng quan
Chiến lược này là một hệ thống giao dịch tiên tiến kết hợp bộ dao động WaveTrend với các dải trung bình động EMA. Bằng cách tích hợp hai chỉ báo kỹ thuật này, một chiến lược giao dịch được hình thành có thể nắm bắt chính xác các điểm ngoặt trong xu hướng thị trường. Chiến lược này áp dụng các thiết lập dừng lợi nhuận và dừng lỗ linh hoạt, theo đuổi lợi nhuận cao hơn trong khi vẫn bảo vệ an ninh vốn.
Nguyên tắc chiến lược
Cốt lõi của chiến lược này là xác định tín hiệu giao dịch thông qua sự phối hợp của chỉ báo WaveTrend và tám đường trung bình động EMA. Chỉ báo WaveTrend đo trạng thái mua quá mức hoặc bán quá mức của thị trường bằng cách tính toán độ lệch giữa giá và đường trung bình động. Đường trung bình động EMA xác nhận hướng xu hướng bằng cách cắt đường trung bình động của các giai đoạn khác nhau. Cụ thể:
- Khi EMA2 cắt EMA8 hoặc tín hiệu tam giác màu xanh xuất hiện (EMA2 cắt EMA3) và không có mô hình kim cương máu, tín hiệu dài hạn sẽ được kích hoạt.
- Khi EMA8 cắt EMA2 hoặc xuất hiện mô hình kim cương đỏ, tín hiệu ngắn sẽ được kích hoạt.
- Cài đặt dừng lỗ sử dụng điểm cực trị sau tín hiệu đảo ngược trước đó, có thể kiểm soát rủi ro hiệu quả
- Mục tiêu lợi nhuận được đặt ở mức gấp 2-3 lần khoảng cách dừng lỗ, phản ánh tỷ lệ rủi ro-lợi nhuận tốt
Lợi thế chiến lược
- Cơ chế xác nhận kép cải thiện độ tin cậy của tín hiệu giao dịch
- Cài đặt dừng lỗ động có thể thích ứng tốt hơn với biến động của thị trường
- Với thiết lập tỷ lệ rủi ro-lợi nhuận rõ ràng
- Việc sử dụng các dải trung bình động EMA giúp xác định xu hướng chung của thị trường
- Chỉ báo WaveTrend có thể xác định hiệu quả tình trạng thị trường quá mua và quá bán
- Logic chiến lược rõ ràng, dễ hiểu và dễ thực hiện
Rủi ro chiến lược
- Tín hiệu sai thường xuyên có thể xảy ra trong thị trường biến động
- Lệnh dừng lỗ động có thể dễ dàng được kích hoạt trong những biến động bất ổn
- Các chỉ số dựa vào dữ liệu lịch sử có thể không hiệu quả khi thị trường thay đổi mạnh.
- Việc sử dụng nhiều chỉ báo kỹ thuật có thể dẫn đến tín hiệu bị chậm trễ
Giải pháp:
- Có thể thêm bộ lọc biến động để giảm tín hiệu sai trong thị trường biến động
- Hãy cân nhắc sử dụng thiết lập dừng lỗ lỏng lẻo hơn
- Thêm cơ chế xác nhận sức mạnh xu hướng
Hướng tối ưu hóa chiến lược
- Giới thiệu các chỉ số biến động thị trường (như ATR) để điều chỉnh khoảng cách dừng lỗ một cách linh hoạt
- Thêm cơ chế xác nhận âm lượng để cải thiện độ tin cậy của tín hiệu
- Hãy cân nhắc thêm bộ lọc cường độ xu hướng để chỉ giao dịch trong các thị trường có xu hướng mạnh
- Tối ưu hóa các tham số WaveTrend để thích ứng tốt hơn với các môi trường thị trường khác nhau
- Nghiên cứu sự hiệp lực của các tín hiệu ở các khoảng thời gian khác nhau
Tóm tắt
Đây là một hệ thống giao dịch hoàn chỉnh kết hợp giữa việc theo dõi xu hướng và các chỉ báo dao động từ phân tích kỹ thuật. Bằng cách sử dụng kết hợp các dải trung bình động WaveTrend và EMA, bạn không chỉ nắm bắt được xu hướng chung mà còn có thể tham gia thị trường kịp thời tại thời điểm chuyển hướng của xu hướng. Cơ chế quản lý dừng lỗ và dừng lãi năng động cung cấp cho chiến lược khả năng kiểm soát rủi ro tốt. Không gian tối ưu hóa của chiến lược chủ yếu nằm ở việc cải thiện khả năng lọc tín hiệu và quản lý rủi ro.
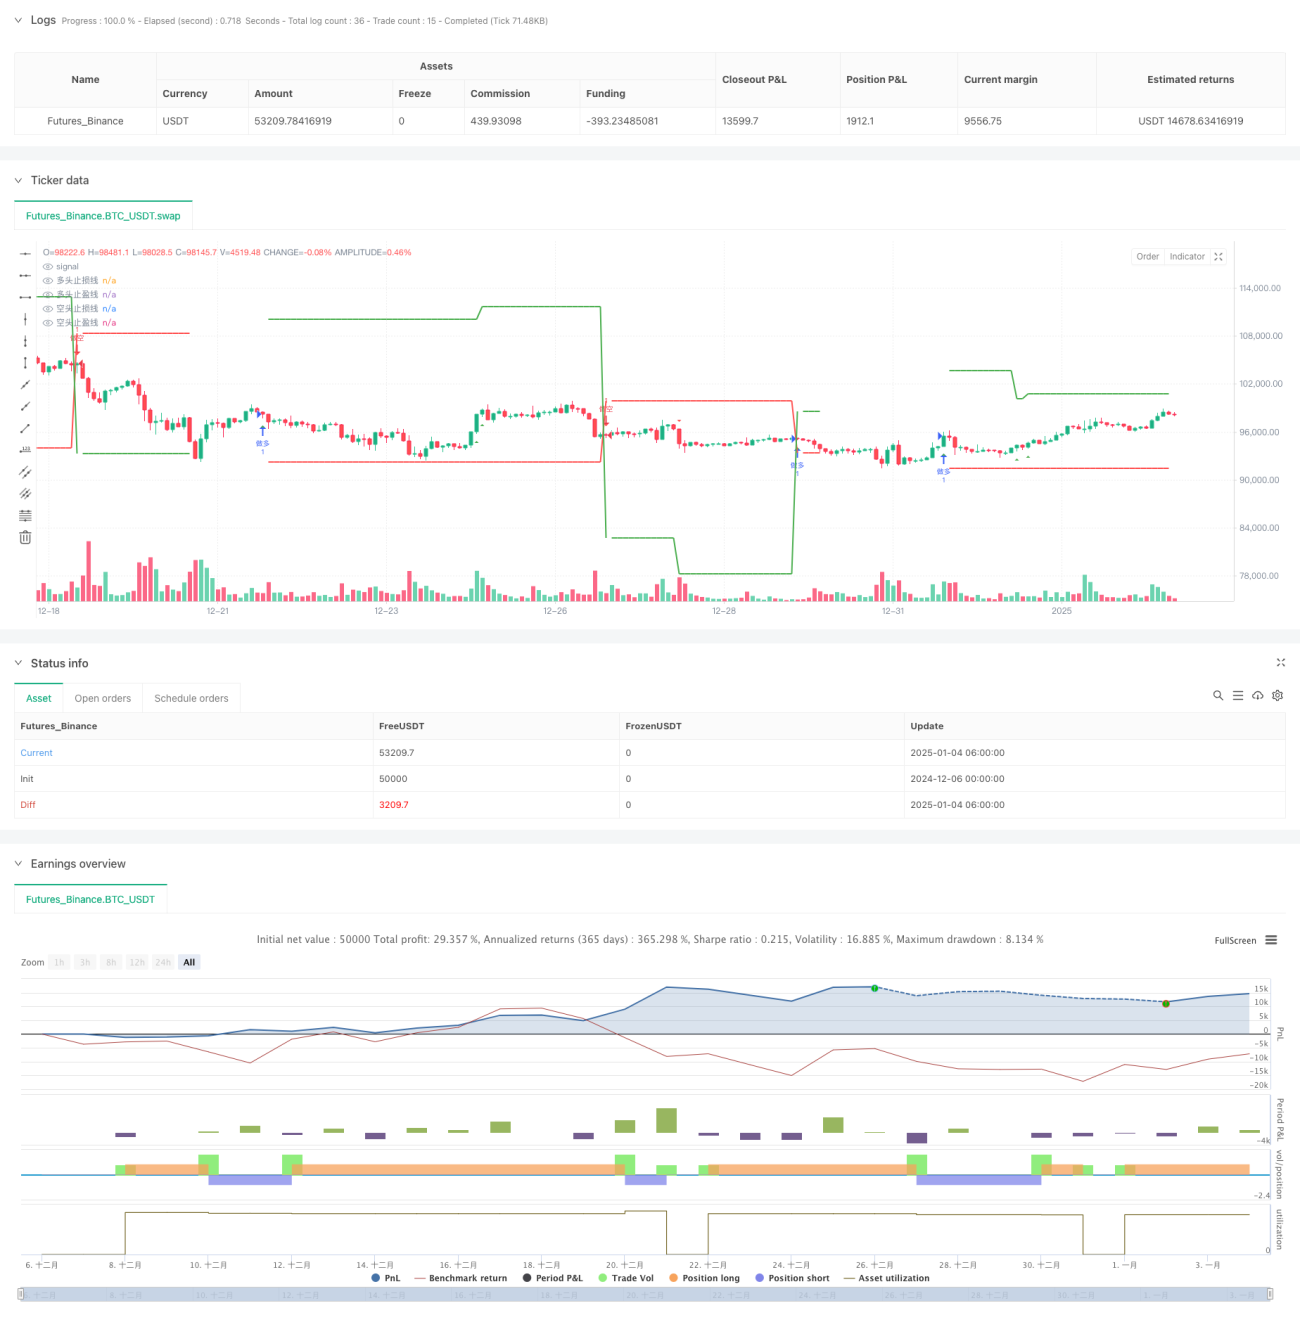
/*backtest
start: 2024-12-06 00:00:00
end: 2025-01-04 08:00:00
period: 2h
basePeriod: 2h
exchanges: [{"eid":"Futures_Binance","currency":"BTC_USDT"}]
*/

//@version=5
strategy("VuManChu Cipher A Strategy", overlay=true, initial_capital=10000, default_qty_type=strategy.fixed, default_qty_value=1.0)

// === 函数定义 ===- 1