
Tổng quan
Chiến lược này là một hệ thống giao dịch định lượng dựa trên sự giao nhau của đường trung bình động và các chỉ báo RSI, chủ yếu được sử dụng để giao dịch trên thị trường quyền chọn. Chiến lược này sử dụng các tín hiệu giao nhau của đường trung bình động nhanh và chậm, kết hợp với mức quá mua và quá bán của RSI để xác định thời điểm giao dịch, đồng thời đặt mức chốt lời và dừng lỗ để kiểm soát rủi ro. Chiến lược này phù hợp để giao dịch trong khung thời gian 5 phút.
Nguyên tắc chiến lược
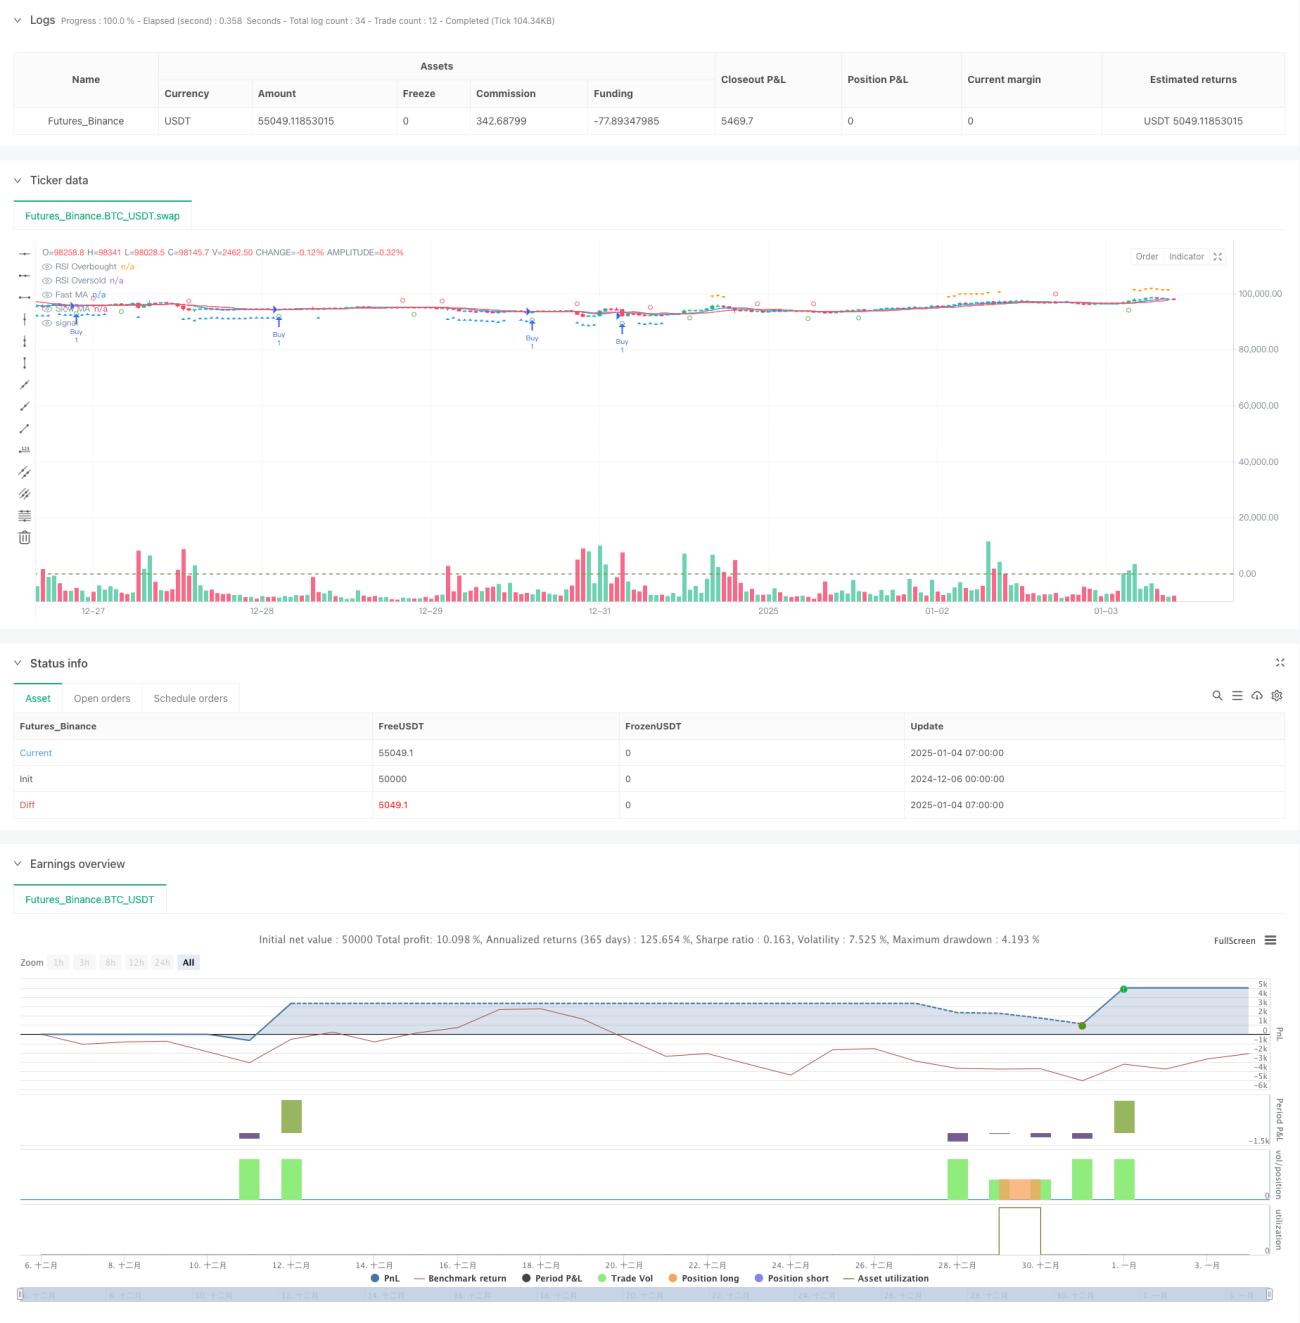
Chiến lược này sử dụng hai chỉ báo kỹ thuật chính: Đường trung bình động (MA) và Chỉ số sức mạnh tương đối (RSI). Cụ thể:
- Sử dụng đường trung bình động đơn giản (SMA) 7 kỳ và 13 kỳ để nắm bắt xu hướng giá
- Sử dụng chỉ báo RSI 17 kỳ để xác định tình trạng mua quá mức và bán quá mức
- Khi đường trung bình động nhanh cắt đường trung bình động chậm theo hướng lên trên và RSI dưới 43, hệ thống sẽ tạo ra tín hiệu dài hạn.
- Khi đường trung bình động nhanh cắt đường trung bình động chậm theo hướng xuống và RSI cao hơn 64, hệ thống sẽ tạo ra tín hiệu ngắn
- Đặt mức chốt lời 4% và mức dừng lỗ 0,5% để quản lý rủi ro
Lợi thế chiến lược
- Cơ chế xác nhận nhiều: Kết hợp đường trung bình động chéo và các chỉ báo RSI để cung cấp tín hiệu giao dịch đáng tin cậy hơn
- Quản lý rủi ro hoàn hảo: thiết lập tỷ lệ phần trăm cố định của mức dừng lỗ và dừng lãi để kiểm soát rủi ro hiệu quả
- Khả năng thích ứng mạnh mẽ: các thông số có thể được điều chỉnh linh hoạt theo các điều kiện thị trường khác nhau
- Hỗ trợ trực quan hóa: Chiến lược cung cấp hướng dẫn đồ họa rõ ràng để giúp các nhà giao dịch hiểu được điều kiện thị trường
- Quy tắc vận hành rõ ràng: điều kiện ra vào rõ ràng, giảm thiểu sự can thiệp do phán đoán chủ quan
Rủi ro chiến lược
- Rủi ro thị trường biến động: Có thể xảy ra tín hiệu sai thường xuyên trong thị trường đi ngang và biến động
- Rủi ro trượt giá: Khi thị trường quyền chọn không thanh khoản, bạn có thể phải đối mặt với tình trạng trượt giá lớn
- Độ nhạy của tham số: Hiệu quả của chiến lược nhạy cảm với các cài đặt tham số và cần được tối ưu hóa liên tục.
- Sự phụ thuộc vào môi trường thị trường: Trong môi trường thị trường biến động, lệnh dừng lỗ có thể không đủ kịp thời
- Rủi ro hệ thống: Khi thị trường có khoảng trống hoặc các sự kiện lớn xảy ra, lệnh dừng lỗ có thể không thành công
Hướng tối ưu hóa chiến lược
- Giới thiệu các chỉ báo biến động: Cân nhắc kết hợp ATR hoặc Bollinger Bands vào hệ thống ra quyết định của bạn
- Tối ưu hóa việc điều chỉnh tham số: Phát triển cơ chế điều chỉnh tham số động dựa trên các điều kiện thị trường
- Tăng cường lọc tâm lý thị trường: Kết hợp khối lượng giao dịch và các chỉ báo khác để lọc ra các tín hiệu sai
- Cải thiện cơ chế dừng lỗ: cân nhắc việc đưa ra lệnh dừng lỗ theo sau để cải thiện hiệu quả quản lý rủi ro
- Thêm bộ lọc thời gian: thêm giới hạn thời gian giao dịch để tránh giao dịch kém hiệu quả
Tóm tắt
Chiến lược này xây dựng một hệ thống giao dịch tương đối hoàn chỉnh bằng cách kết hợp đường trung bình động cắt nhau và chỉ báo RSI. Ưu điểm của chiến lược này nằm ở khả năng xác nhận nhiều tín hiệu và quản lý rủi ro hoàn hảo, nhưng cũng cần phải chú ý đến tác động của môi trường thị trường đến hiệu quả của chiến lược. Thông qua quá trình tối ưu hóa và cải tiến liên tục, chiến lược này dự kiến sẽ đạt được hiệu suất ổn định trên thị trường quyền chọn. Các nhà giao dịch được khuyến nghị nên tiến hành kiểm tra ngược và tối ưu hóa tham số đầy đủ trước khi sử dụng theo thời gian thực.
- 1