Thuật toán kết hợp động của chiến lược giao dịch xu hướng Supertrend đa thời gian

Tổng quan
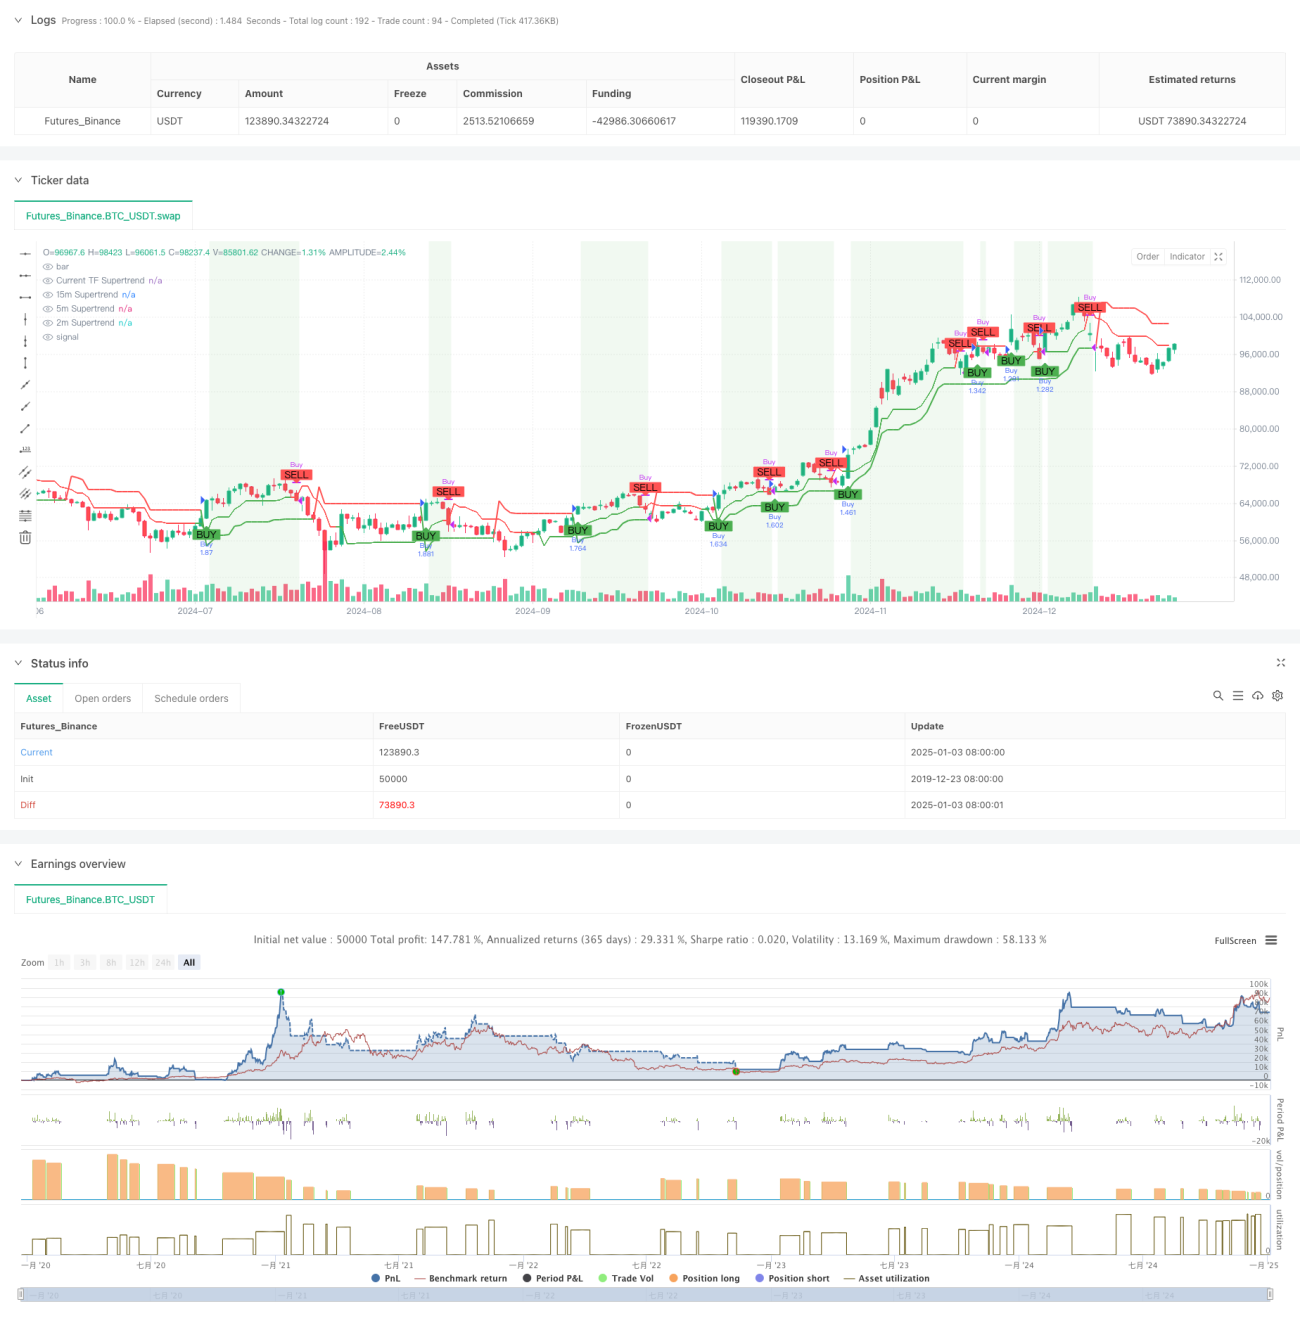
Chiến lược này là hệ thống theo dõi xu hướng thích ứng dựa trên chỉ báo Supertrend đa khung thời gian. Công cụ này xây dựng một khuôn khổ nhận dạng xu hướng toàn diện bằng cách tích hợp các tín hiệu Supertrend từ ba khoảng thời gian khác nhau: 15 phút, 5 phút và 2 phút. Chiến lược này sử dụng bộ lọc thời gian để đảm bảo chỉ chạy trong những giờ giao dịch sôi động nhất và tự động đóng các vị thế vào cuối ngày để tránh rủi ro qua đêm.
Nguyên tắc chiến lược
Cốt lõi của chiến lược này là xác nhận tín hiệu giao dịch thông qua tính nhất quán của xu hướng trong nhiều khoảng thời gian. Cụ thể:
- Đường Supertrend được tính toán cho từng khoảng thời gian bằng cách sử dụng chu kỳ ATR và hệ số nhân.
- Lệnh mua được kích hoạt khi tín hiệu tăng giá xuất hiện trên cả ba khung thời gian (giá nằm trên đường Siêu xu hướng).
- Lệnh bán được kích hoạt khi giá giảm xuống dưới đường Supertrend 5 phút hoặc đến cuối ngày giao dịch.
- Kiểm soát giờ giao dịch bằng cách thiết lập múi giờ và bộ lọc phiên giao dịch (mặc định là 09:30-15:30).
Lợi thế chiến lược
- Xác nhận xu hướng đa chiều cải thiện độ tin cậy của tín hiệu và giảm thiểu hiệu quả nguy cơ đột phá sai.
- Cài đặt tham số Adaptive Supertrend cho phép chiến lược thích ứng với các môi trường biến động khác nhau của thị trường.
- Cơ chế quản lý thời gian chặt chẽ giúp tránh sự can thiệp từ các giai đoạn giao dịch không hiệu quả.
- Giao diện trực quan rõ ràng hiển thị trạng thái xu hướng của mọi khoảng thời gian.
- Hệ thống quản lý vị trí linh hoạt hỗ trợ cấu hình phần trăm.
Rủi ro chiến lược
- Trong một thị trường đi ngang và biến động, quá nhiều tín hiệu giao dịch có thể được tạo ra, làm tăng chi phí giao dịch.
- Nhiều điều kiện lọc có thể dẫn đến việc bỏ lỡ một số cơ hội có khả năng sinh lời.
- Phụ thuộc vào việc tối ưu hóa thông số và các môi trường thị trường khác nhau có thể yêu cầu điều chỉnh thông số.
- Độ phức tạp về mặt tính toán cao và có thể có vấn đề về hiệu quả thực thi chương trình.
Hướng tối ưu hóa chiến lược
- Giới thiệu cơ chế thích ứng với biến động để điều chỉnh linh hoạt các tham số Supertrend theo điều kiện thị trường.
- Thêm các chỉ báo xác nhận khối lượng để cải thiện độ chính xác của phán đoán xu hướng.
- Phát triển các thuật toán lọc thời gian thông minh để tự động xác định giờ giao dịch tốt nhất.
- Tối ưu hóa các thuật toán quản lý vị thế để đạt được khả năng kiểm soát rủi ro tinh vi hơn.
- Thêm mô-đun phân loại môi trường thị trường và áp dụng các chiến lược khác biệt dựa trên các đặc điểm khác nhau của thị trường.
Tóm tắt
Chiến lược này xây dựng một hệ thống giao dịch mạnh mẽ thông qua phân tích xu hướng nhiều giai đoạn và hệ thống kiểm soát rủi ro chặt chẽ. Mặc dù vẫn còn một số chỗ cần tối ưu hóa, nhưng logic cốt lõi của nó rất vững chắc và phù hợp để phát triển thêm và ứng dụng trong thế giới thực. Thiết kế mô-đun của hệ thống cũng cung cấp nền tảng tốt cho việc mở rộng trong tương lai.
- 1