Phân tích chiến lược Adaptive Bollinger Band dựa trên dãy Fibonacci

ATR BB SMA FIB
Ngày tạo: 2025-01-06 16:41:48 sửa đổi lần cuối: 2025-01-06 16:41:48
sao chép: 2 Số nhấp chuột: 434
1
tập trung vào
1617
Người theo dõi

Phân tích chiến lược Adaptive Bollinger Band dựa trên dãy Fibonacci

Tổng quan

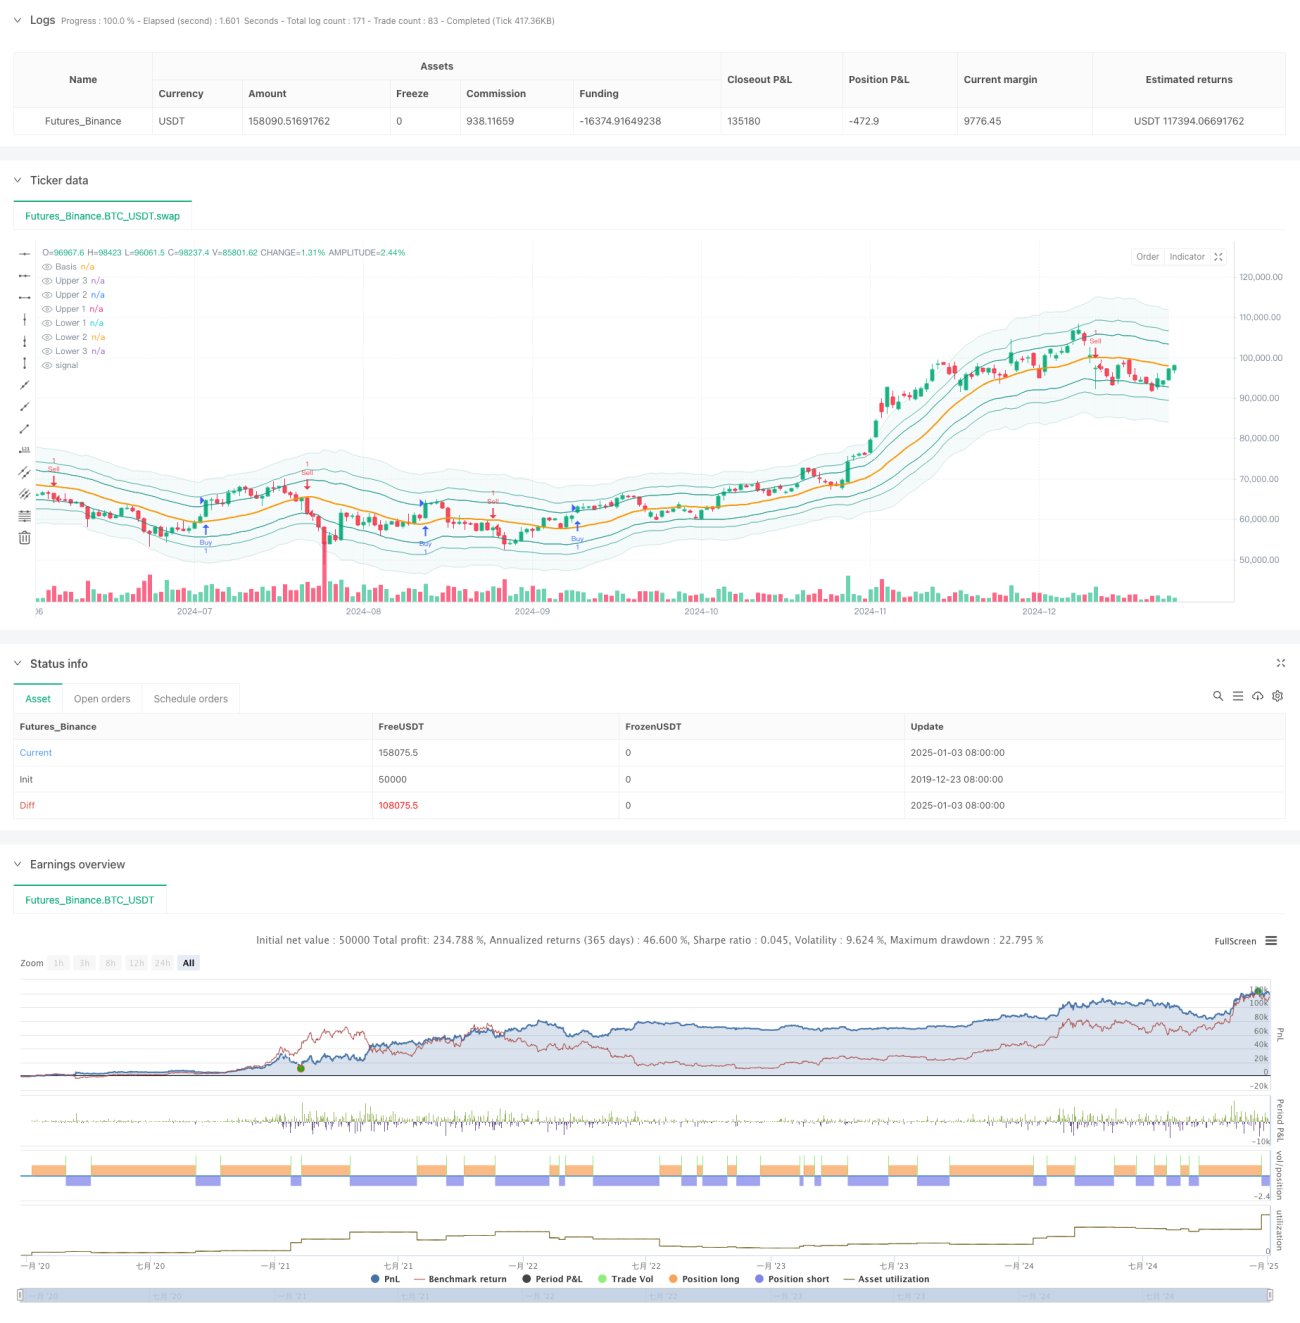
Chiến lược này là một hệ thống giao dịch sáng tạo kết hợp chuỗi Fibonacci và dải Bollinger. Nó hình thành nên một hệ thống đánh giá phạm vi biến động giá độc đáo bằng cách thay thế các bội số độ lệch chuẩn của Dải Bollinger truyền thống bằng tỷ lệ Fibonacci (1,618, 2,618, 4,236). Chiến lược này bao gồm các chức năng quản lý giao dịch hoàn chỉnh, bao gồm cài đặt dừng lợi nhuận, dừng lỗ và lọc cửa sổ thời gian giao dịch, khiến nó trở nên thực tế và linh hoạt cao.

Nguyên tắc chiến lược

Logic cốt lõi của chiến lược này dựa trên sự tương tác giữa giá và dải Fibonacci Bollinger. Đầu tiên, hãy tính đường trung bình động đơn giản (SMA) của giá làm đường ở giữa, sau đó sử dụng ATR nhân với các tỷ lệ Fibonacci khác nhau để tạo thành đường trên và đường dưới. Khi giá vượt qua dải Fibonacci do người dùng chọn, hệ thống sẽ tạo ra tín hiệu giao dịch. Cụ thể, tín hiệu dài hạn được kích hoạt khi giá thấp nhất thấp hơn biên độ mua mục tiêu và giá cao nhất cao hơn biên độ; tín hiệu ngắn hạn được kích hoạt khi giá thấp nhất thấp hơn biên độ bán mục tiêu và giá cao nhất cao hơn biên độ. hơn là ban nhạc.

Lợi thế chiến lược

  1. Khả năng thích ứng mạnh mẽ: Điều chỉnh băng thông một cách linh hoạt thông qua ATR để giúp chiến lược thích ứng tốt hơn với các môi trường thị trường khác nhau
  2. Tính linh hoạt cao: Người dùng có thể chọn các dải Fibonacci khác nhau làm tín hiệu giao dịch theo phong cách giao dịch của họ
  3. Quản lý rủi ro hoàn hảo: tích hợp chức năng dừng lỗ, dừng lãi và lọc thời gian để kiểm soát rủi ro hiệu quả
  4. Trực quan: Các dải minh bạch khác nhau được hiển thị để giúp các nhà giao dịch hiểu được cấu trúc thị trường
  5. Logic tính toán rõ ràng: Sử dụng kết hợp chỉ báo kỹ thuật cổ điển, dễ hiểu và dễ bảo trì

Rủi ro chiến lược

  1. Rủi ro đột phá sai: Giá có thể giảm trở lại ngay sau khi đột phá, tạo ra tín hiệu sai
  2. Độ nhạy tham số: Các lựa chọn khác nhau của tỷ lệ Fibonacci có thể ảnh hưởng đáng kể đến hiệu suất chiến lược
  3. Phụ thuộc vào thời gian: Nếu bạn bật cửa sổ thời gian giao dịch, bạn có thể bỏ lỡ các cơ hội giao dịch quan trọng
  4. Sự phụ thuộc vào môi trường thị trường: có thể tạo ra quá nhiều tín hiệu giao dịch trong một thị trường biến động

Hướng tối ưu hóa chiến lược

  1. Cơ chế xác nhận tín hiệu: Nên thêm các chỉ báo khối lượng hoặc động lượng để xác nhận đột phá
  2. Tối ưu hóa tham số động: Tỷ lệ Fibonacci có thể được tự động điều chỉnh dựa trên sự biến động của thị trường
  3. Lọc môi trường thị trường: Thêm chức năng đánh giá xu hướng và sử dụng các tham số khác nhau trong các môi trường thị trường khác nhau
  4. Hệ thống trọng số tín hiệu: Thiết lập phân tích nhiều khung thời gian để cải thiện độ tin cậy của tín hiệu
  5. Tối ưu hóa quản lý vị thế: điều chỉnh động quy mô vị thế dựa trên sự biến động của thị trường và cường độ tín hiệu

Tóm tắt

Đây là chiến lược kết hợp sáng tạo các công cụ phân tích kỹ thuật cổ điển và tối ưu hóa chiến lược Bollinger Band truyền thống thông qua chuỗi Fibonacci. Ưu điểm chính của nó nằm ở khả năng thích ứng và linh hoạt, nhưng khi sử dụng cần chú ý đến sự phù hợp giữa lựa chọn thông số và môi trường thị trường. Chiến lược này vẫn còn nhiều chỗ cần cải thiện bằng cách bổ sung thêm các chỉ báo xác nhận và tối ưu hóa cơ chế tạo tín hiệu.

Mã nguồn chiến lược
/*backtest
start: 2019-12-23 08:00:00
end: 2025-01-04 08:00:00
period: 1d
basePeriod: 1d
exchanges: [{"eid":"Futures_Binance","currency":"BTC_USDT"}]
*/

//@version=5
// © sapphire_edge 

// # ========================================================================= #
// #                  
// #        _____                   __    _              ______    __         
// #      / ___/____ _____  ____  / /_  (_)_______     / ____/___/ /___ ____ 
// #      \__ \/ __ `/ __ \/ __ \/ __ \/ / ___/ _ \   / __/ / __  / __ `/ _ \
// #     ___/ / /_/ / /_/ / /_/ / / / / / /  /  __/  / /___/ /_/ / /_/ /  __/
// #    /____/\__,_/ .___/ .___/_/ /_/_/_/   \___/  /_____/\__,_/\__, /\___/ 
// #              /_/   /_/                                     /____/       
// #                                      
// # ========================================================================= #

strategy(shorttitle="⟡Sapphire⟡ FiboBands Strategy", title="[Sapphire] Fibonacci Bollinger Bands Strategy", initial_capital= 50000, currency= currency.USD,default_qty_value = 1,commission_type= strategy.commission.cash_per_contract,overlay= true )

// # ========================================================================= #
// #                       // Settings Menu //
// # ========================================================================= #

// --------------------    Main Settings    -------------------- //
groupFiboBands = "FiboBands"
length = input.int(20, minval = 1, title = 'Length', group=groupFiboBands)
src = input(close, title = 'Source', group=groupFiboBands)
offset = input.int(0, 'Offset', minval = -500, maxval = 500, group=groupFiboBands)

fibo1 = input(defval = 1.618, title = 'Fibonacci Ratio 1', group=groupFiboBands)
fibo2 = input(defval = 2.618, title = 'Fibonacci Ratio 2', group=groupFiboBands)
fibo3 = input(defval = 4.236, title = 'Fibonacci Ratio 3', group=groupFiboBands)

fiboBuy = input.string(options = ['Fibo 1', 'Fibo 2', 'Fibo 3'], defval = 'Fibo 1', title = 'Fibonacci Buy', group=groupFiboBands)
fiboSell = input.string(options = ['Fibo 1', 'Fibo 2', 'Fibo 3'], defval = 'Fibo 1', title = 'Fibonacci Sell', group=groupFiboBands)

showSignals = input.bool(true, title="Show Signals", group=groupFiboBands)
signalOffset = input.int(5, title="Signal Vertical Offset", group=groupFiboBands)

// --------------------    Trade Management Inputs    -------------------- //
groupTradeManagement = "Trade Management"
useProfitPerc    = input.bool(false, title="Enable Profit Target", group=groupTradeManagement)
takeProfitPerc  = input.float(1.0, title="Take Profit (%)", step=0.1, group=groupTradeManagement)
useStopLossPerc    = input.bool(false, title="Enable Stop Loss", group=groupTradeManagement)
stopLossPerc    = input.float(1.0, title="Stop Loss (%)", step=0.1, group=groupTradeManagement)

// --------------------    Time Filter Inputs    -------------------- //
groupTimeOfDayFilter = "Time of Day Filter"
useTimeFilter1  = input.bool(false, title="Enable Time Filter 1", group=groupTimeOfDayFilter)
startHour1      = input.int(0, title="Start Hour (24-hour format)", minval=0, maxval=23, group=groupTimeOfDayFilter)
startMinute1    = input.int(0, title="Start Minute", minval=0, maxval=59, group=groupTimeOfDayFilter)
endHour1        = input.int(23, title="End Hour (24-hour format)", minval=0, maxval=23, group=groupTimeOfDayFilter)
endMinute1      = input.int(45, title="End Minute", minval=0, maxval=59, group=groupTimeOfDayFilter)
closeAtEndTimeWindow = input.bool(false, title="Close Trades at End of Time Window", group=groupTimeOfDayFilter)

// --------------------    Trading Window    -------------------- //
isWithinTradingWindow(startHour, startMinute, endHour, endMinute) =>
    nyTime            = timestamp("America/New_York", year, month, dayofmonth, hour, minute)
    nyHour            = hour(nyTime)
    nyMinute          = minute(nyTime)
    timeInMinutes     = nyHour * 60 + nyMinute
    startInMinutes    = startHour * 60 + startMinute
    endInMinutes      = endHour * 60 + endMinute
    timeInMinutes    >= startInMinutes and timeInMinutes <= endInMinutes

timeCondition =  (useTimeFilter1 ? isWithinTradingWindow(startHour1, startMinute1, endHour1, endMinute1) : true)

// Check if the current bar is the last one within the specified time window
isEndOfTimeWindow() =>
    nyTime            = timestamp("America/New_York", year, month, dayofmonth, hour, minute)
    nyHour            = hour(nyTime)
    nyMinute          = minute(nyTime)
    timeInMinutes     = nyHour * 60 + nyMinute
    endInMinutes      = endHour1 * 60 + endMinute1
    timeInMinutes == endInMinutes

// Logic to close trades if the time window ends
if timeCondition and closeAtEndTimeWindow and isEndOfTimeWindow()
    strategy.close_all(comment="Closing trades at end of time window")

// # ========================================================================= #
// #                       // Calculations //
// # ========================================================================= #

sma = ta.sma(src, length)
atr = ta.atr(length)

ratio1 = atr * fibo1
ratio2 = atr * fibo2
ratio3 = atr * fibo3

upper3 = sma + ratio3
upper2 = sma + ratio2
upper1 = sma + ratio1

lower1 = sma - ratio1
lower2 = sma - ratio2
lower3 = sma - ratio3

// # ========================================================================= #
// #                       // Signal Logic //
// # ========================================================================= #

// --------------------    Entry Logic    -------------------- //
targetBuy = fiboBuy == 'Fibo 1' ? upper1 : fiboBuy == 'Fibo 2' ? upper2 : upper3
buy = low < targetBuy and high > targetBuy

// --------------------    User-Defined Exit Logic    -------------------- //
targetSell = fiboSell == 'Fibo 1' ? lower1 : fiboSell == 'Fibo 2' ? lower2 : lower3
sell = low < targetSell and high > targetSell

// # ========================================================================= #
// #                       // Strategy Management //
// # ========================================================================= #

// --------------------    Trade Execution Flags    -------------------- //
var bool buyExecuted = false
var bool sellExecuted = false

float labelOffset = ta.atr(14) * signalOffset

// --------------------    Buy Logic    -------------------- //
if buy and timeCondition 
    if useProfitPerc or useStopLossPerc
        strategy.entry("Buy", strategy.long, stop=(useStopLossPerc ? close * (1 - stopLossPerc / 100) : na), limit=(useProfitPerc ? close * (1 + takeProfitPerc / 100) : na))
    else
        strategy.entry("Buy", strategy.long)

    if showSignals and not buyExecuted
        buyExecuted := true  
        sellExecuted := false  
        label.new(bar_index, high - labelOffset, "◭", style=label.style_label_up, color = color.rgb(119, 0, 255, 20), textcolor=color.white)

// --------------------    Sell Logic    -------------------- //
if sell and timeCondition
    if useProfitPerc or useStopLossPerc
        strategy.entry("Sell", strategy.short, stop=(useStopLossPerc ? close * (1 + stopLossPerc / 100) : na), limit=(useProfitPerc ? close * (1 - takeProfitPerc / 100) : na))
    else
        strategy.entry("Sell", strategy.short)

    if showSignals and not sellExecuted
        sellExecuted := true 
        buyExecuted := false  
        label.new(bar_index, low + labelOffset, "⧩", style=label.style_label_down, color = color.rgb(255, 85, 0, 20), textcolor=color.white)


// # ========================================================================= #
// #                         // Plots and Charts //
// # ========================================================================= #

plot(sma, style = plot.style_line, title = 'Basis', color = color.new(color.orange, 0), linewidth = 2, offset = offset)

upp3 = plot(upper3, title = 'Upper 3', color = color.new(color.teal, 90), offset = offset)
upp2 = plot(upper2, title = 'Upper 2', color = color.new(color.teal, 60), offset = offset)
upp1 = plot(upper1, title = 'Upper 1', color = color.new(color.teal, 30), offset = offset)

low1 = plot(lower1, title = 'Lower 1', color = color.new(color.teal, 30), offset = offset)
low2 = plot(lower2, title = 'Lower 2', color = color.new(color.teal, 60), offset = offset)
low3 = plot(lower3, title = 'Lower 3', color = color.new(color.teal, 90), offset = offset)

fill(upp3, low3, title = 'Background', color = color.new(color.teal, 95))