Chiến lược giao dịch đảo ngược động lượng chỉ báo kỹ thuật kép kết hợp với hệ thống quản lý rủi ro

Tổng quan
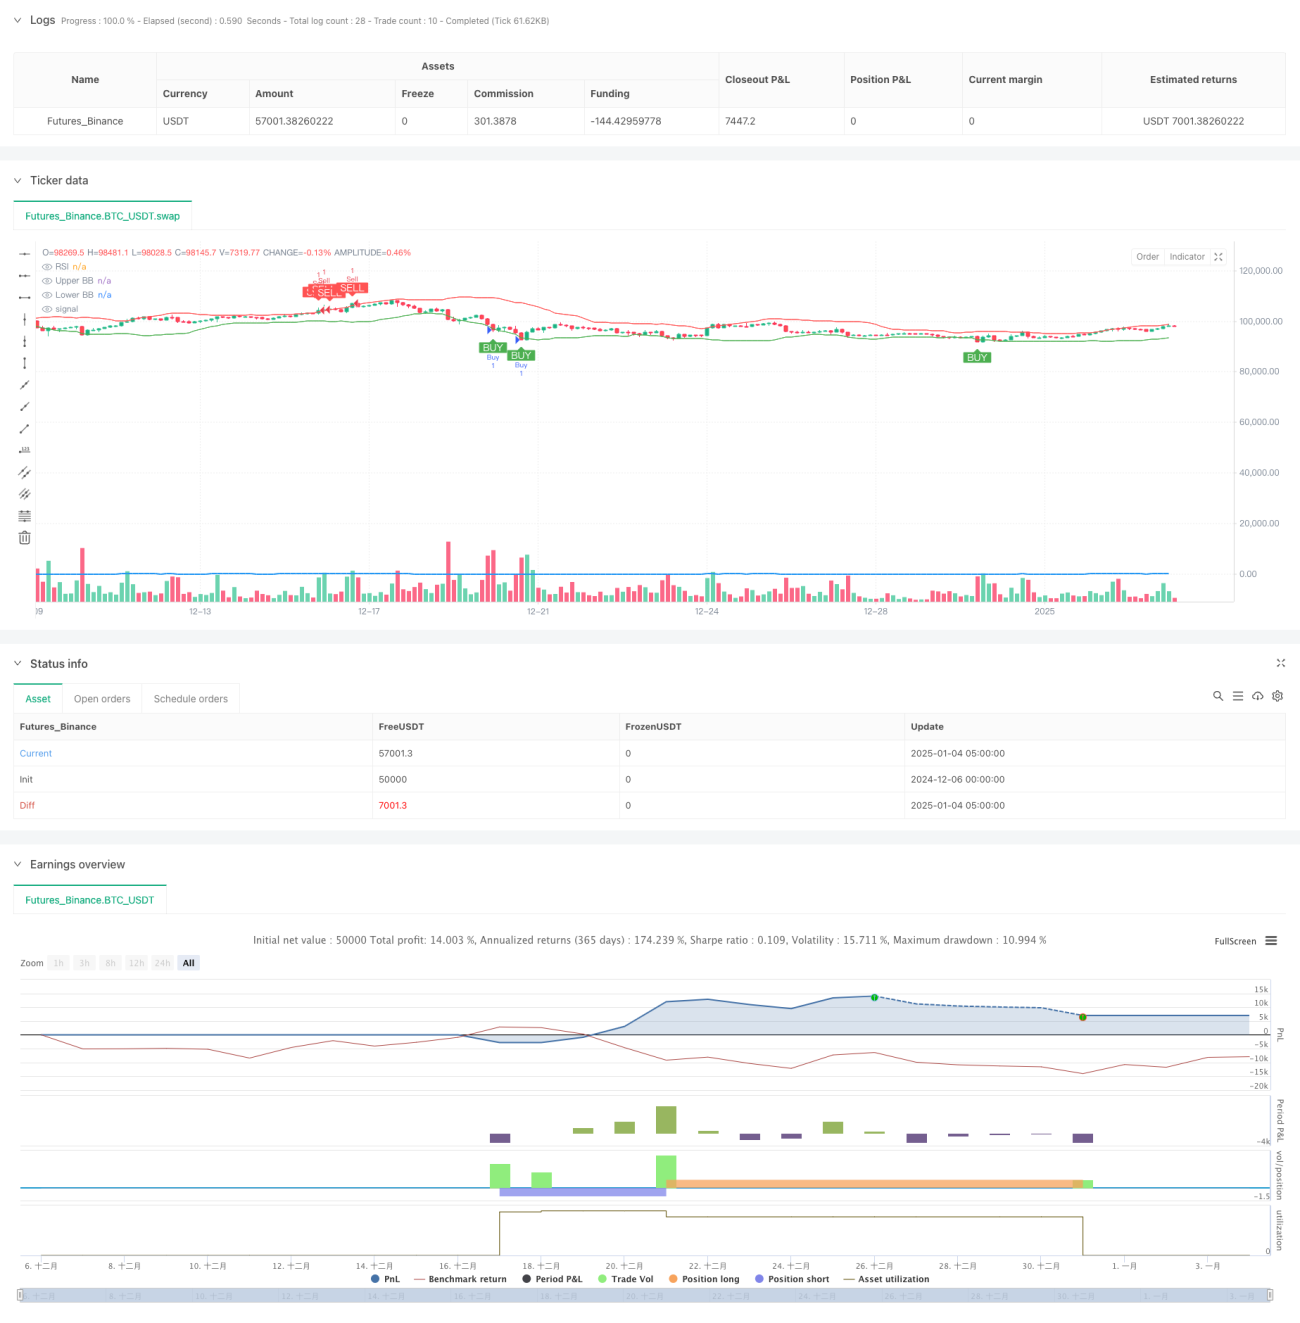
Chiến lược này là hệ thống giao dịch đảo ngược động lượng kết hợp các chỉ báo kỹ thuật kép RSI và Bollinger Bands để giao dịch bằng cách xác định các vùng quá mua và quá bán. Chiến lược này sử dụng tỷ lệ rủi ro-lợi nhuận là 1:2 và kết hợp lệnh dừng lỗ di động để kiểm soát rủi ro. Nguyên tắc cốt lõi là giao dịch khi cả RSI và Bollinger Bands đều cho thấy tín hiệu quá mua hoặc quá bán cùng một lúc và bảo vệ tiền thông qua quản lý rủi ro chặt chẽ.
Nguyên tắc chiến lược
Chiến lược này sử dụng RSI 14 kỳ và Bollinger Bands 20 kỳ làm chỉ báo chính. Các điều kiện mua phải được đáp ứng đồng thời: RSI dưới 30 (quá bán) và giá chạm hoặc giảm xuống dưới Dải Bollinger dưới. Các điều kiện bán phải được đáp ứng cùng lúc: RSI trên 70 (mua quá mức) và giá chạm hoặc vượt quá Dải Bollinger trên. Hệ thống sử dụng điểm cao nhất/thấp nhất của 5 đường K làm điểm dừng lỗ di động và vị thế chốt lời gấp đôi khoảng cách dừng lỗ, thực hiện nghiêm ngặt tỷ lệ rủi ro-lợi nhuận là 1:2.
Lợi thế chiến lược
- Lọc chỉ số kỹ thuật kép cải thiện chất lượng tín hiệu và giảm tín hiệu sai
- Kết hợp các chỉ báo động lượng và biến động để cung cấp góc nhìn toàn diện hơn về thị trường
- Cơ chế kiểm soát rủi ro chặt chẽ, bao gồm lệnh dừng lỗ theo sau và tỷ lệ rủi ro-lợi nhuận cố định
- Hệ thống được tự động hóa hoàn toàn, loại bỏ sự can thiệp cảm xúc của con người
- Logic chiến lược rõ ràng, dễ hiểu và dễ duy trì
Rủi ro chiến lược
- Lệnh dừng lỗ có thể thường xuyên xuất hiện trên thị trường có xu hướng
- Điều kiện kép có thể bỏ lỡ một số cơ hội giao dịch
- Các thông số RSI và Bollinger Band cố định có thể không phù hợp với mọi môi trường thị trường
- Việc dừng lỗ có thể dẫn đến việc thoát lệnh sớm trên thị trường biến động
- Cần quản lý tiền hợp lý để đối phó với những khoản thua lỗ liên tiếp
Hướng tối ưu hóa chiến lược
- Giới thiệu cơ chế tham số thích ứng để điều chỉnh động các tham số chỉ báo theo biến động của thị trường
- Đã thêm bộ lọc xu hướng để tạm dừng giao dịch đảo ngược trong các xu hướng mạnh
- Phát triển hệ thống tỷ lệ rủi ro-lợi nhuận năng động và điều chỉnh theo điều kiện thị trường
- Thêm cơ chế xác nhận âm lượng để cải thiện độ tin cậy của tín hiệu
- Triển khai các cơ chế dừng lỗ linh hoạt hơn, chẳng hạn như dừng lỗ theo sau hoặc dừng lỗ theo thời gian
Tóm tắt
Đây là một chiến lược giao dịch đảo chiều có cấu trúc tốt, sử dụng các chỉ báo kỹ thuật kép để tăng độ chính xác và áp dụng quản lý rủi ro chặt chẽ. Mặc dù chiến lược này đơn giản và trực quan, nhưng nó chứa đựng những yếu tố chính cần thiết cho một hệ thống giao dịch hoàn thiện. Thông qua các hướng tối ưu hóa được đề xuất, chiến lược này vẫn còn có thể được cải thiện thêm. Trong giao dịch thực tế, trước tiên bạn nên tiến hành kiểm tra ngược và tối ưu hóa tham số.
- 1