Chiến lược định lượng giao cắt trung bình động SMA xu hướng dài hạn

Tổng quan
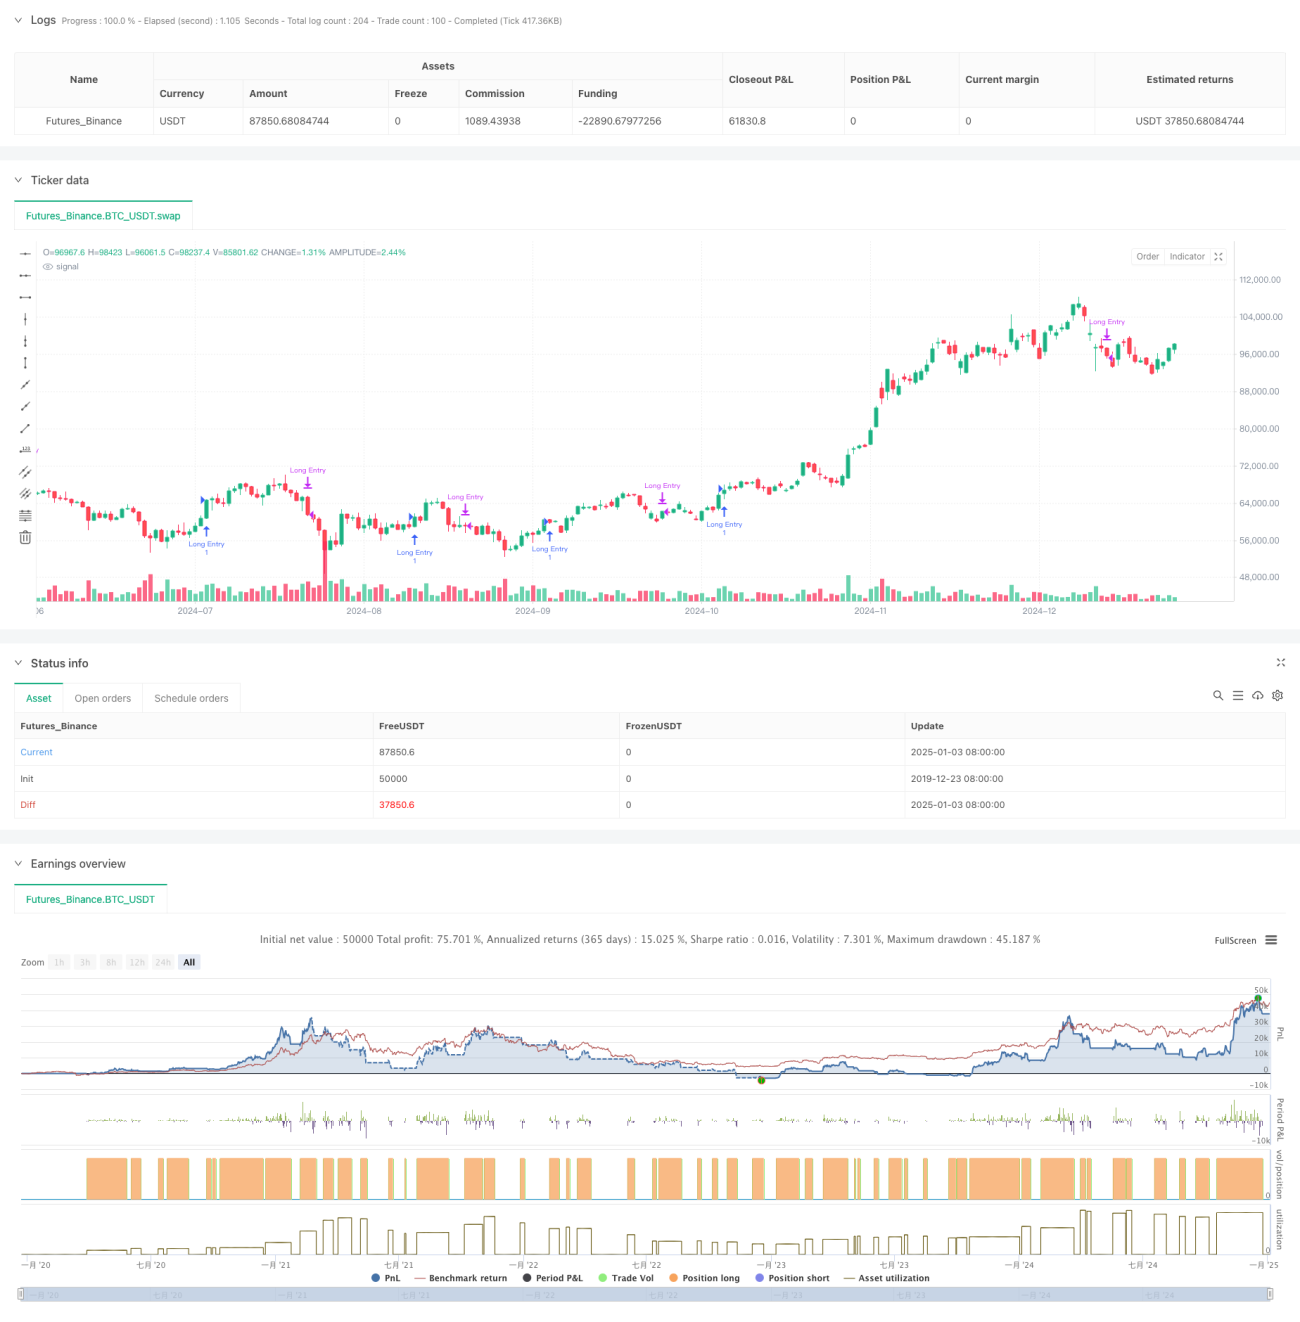
Chiến lược này là một hệ thống giao dịch định lượng dựa trên các tín hiệu giao nhau của đường trung bình động đơn giản (SMA) nhiều giai đoạn. Giao dịch chủ yếu bằng cách xác định các cơ hội thoái lui ngắn hạn trong xu hướng tăng dài hạn. Chiến lược này sử dụng các chỉ báo SMA với năm giai đoạn là 5 ngày, 10 ngày, 20 ngày, 60 ngày và 120 ngày để đánh giá xu hướng thị trường và cơ hội giao dịch thông qua mối quan hệ vị thế và tín hiệu giao nhau của các đường trung bình động.
Nguyên tắc chiến lược
Logic cốt lõi của chiến lược bao gồm những phần chính sau:
- Xu hướng dài hạn có thể được đánh giá bằng mối quan hệ vị trí tương đối giữa SMA20 và SMA60. Khi SMA20 ở trên SMA60, điều đó xác nhận rằng thị trường đang trong xu hướng tăng.
- Dựa trên cơ sở xác nhận xu hướng tăng dài hạn, tín hiệu mua sẽ được kích hoạt khi đường SMA5 ngắn hạn phục hồi từ dưới SMA20 lên trên. Điều này cho thấy thị trường đang phục hồi sau đợt điều chỉnh ngắn hạn trong xu hướng tăng.
- Khi SMA20 cắt SMA5, tín hiệu đóng sẽ được kích hoạt. Điều này cho thấy đà tăng ngắn hạn đã yếu đi và có thể bước vào giai đoạn điều chỉnh.
- Chiến lược này cũng bao gồm chức năng lọc thời gian, có thể giới hạn phạm vi thời gian của thử nghiệm ngược và tăng tính linh hoạt của chiến lược.
Lợi thế chiến lược
- Logic chiến lược rõ ràng và đơn giản, dễ hiểu và triển khai, không liên quan đến các quy trình tính toán phức tạp.
- Bằng cách sử dụng phối hợp nhiều đường trung bình động trong nhiều giai đoạn, chúng ta có thể lọc hiệu quả nhiễu thị trường và cải thiện độ tin cậy của các tín hiệu giao dịch.
- Chiến lược này tập trung vào các cơ hội thoái lui trong thị trường có xu hướng, phù hợp với khái niệm cốt lõi của "giao dịch theo xu hướng".
- Sử dụng SMA thay vì EMA giúp giảm độ nhạy với thay đổi giá và giảm tín hiệu sai.
- Logic vào và ra rõ ràng, giúp thực hiện và kiểm soát rủi ro dễ dàng hơn.
Rủi ro chiến lược
- Hệ thống đường trung bình động có độ trễ, có thể dẫn đến thời điểm vào và thoát lệnh không tối ưu.
- Trong một thị trường biến động, việc đường trung bình động giao nhau thường xuyên có thể tạo ra quá nhiều tín hiệu sai.
- Chiến lược này thiếu cơ chế lọc biến động và có thể phải đối mặt với rủi ro giảm giá lớn hơn trong thời kỳ biến động cao.
- Nếu không tính đến sự hợp tác của các chỉ báo kỹ thuật khác như khối lượng giao dịch, độ tin cậy của tín hiệu cần được cải thiện.
- Các tham số trung bình động cố định có thể không phù hợp với mọi môi trường thị trường.
Hướng tối ưu hóa chiến lược
- Giới thiệu chỉ báo ATR để lọc biến động và tránh giao dịch khi biến động quá cao.
- Thêm cơ chế xác nhận khối lượng để cải thiện độ tin cậy của tín hiệu giao dịch.
- Phát triển cơ chế chu kỳ trung bình động thích ứng để cho phép chiến lược thích ứng tốt hơn với các môi trường thị trường khác nhau.
- Thêm bộ lọc cường độ xu hướng, chẳng hạn như chỉ báo ADX, để đảm bảo giao dịch theo xu hướng mạnh.
- Cải thiện cơ chế dừng lỗ, chẳng hạn như thêm lệnh dừng lỗ theo sau, để kiểm soát rủi ro tốt hơn.
Tóm tắt
Chiến lược này sử dụng đường trung bình động SMA nhiều giai đoạn để xây dựng hệ thống giao dịch tập trung vào việc nắm bắt cơ hội thoái lui trong xu hướng tăng dài hạn. Thiết kế chiến lược ngắn gọn và thiết thực, dễ hiểu và dễ triển khai. Bằng cách đưa ra các biện pháp tối ưu hóa như lọc biến động và xác nhận khối lượng, tính mạnh mẽ và độ tin cậy của chiến lược này dự kiến sẽ được cải thiện hơn nữa.
/*backtest
start: 2019-12-23 08:00:00
end: 2025-01-04 08:00:00
period: 1d
basePeriod: 1d
exchanges: [{"eid":"Futures_Binance","currency":"BTC_USDT"}]
*/

//@version=6
strategy("Long-Term Growing Stock Strategy", overlay=true)
// Date Range
// STEP 1. Create inputs that configure the backtest's date range- 1