Chiến lược thích ứng theo dõi xu hướng giá và khối lượng tần suất cao và phân tích khối lượng

Tổng quan
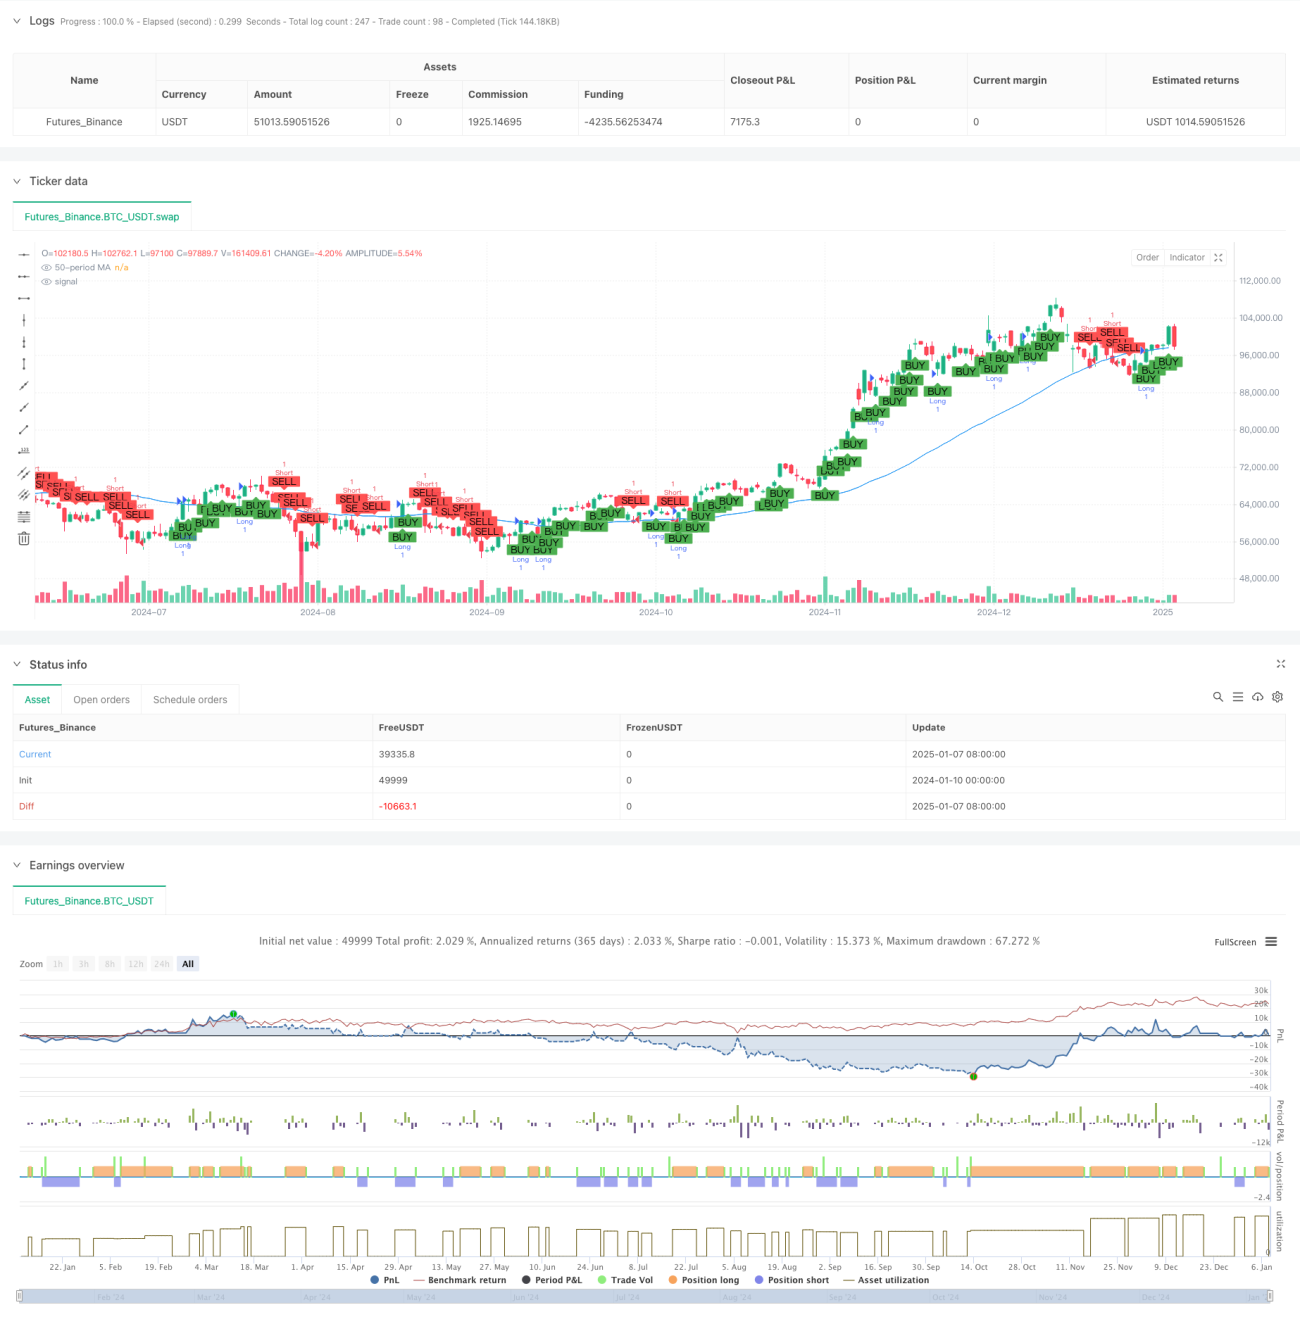
Chiến lược này là một hệ thống giao dịch tự động dựa trên khung thời gian 5 phút kết hợp phương pháp theo dõi xu hướng trung bình động và phân tích khối lượng. Chiến lược này sử dụng đường trung bình động đơn giản (SMA) 50 kỳ để xác định xu hướng thị trường và đưa ra phân tích khối lượng để xác minh tính hợp lệ của các tín hiệu giao dịch. Hệ thống sử dụng mục tiêu dừng lỗ và lợi nhuận cố định để đạt được giao dịch hoàn toàn tự động.
Nguyên tắc chiến lược
Logic cốt lõi của chiến lược bao gồm các thành phần chính sau:
- Nhận dạng xu hướng: Sử dụng SMA 50 kỳ để xác định hướng thị trường. Khi giá đóng cửa cao hơn đường trung bình động, thì được coi là xu hướng tăng, ngược lại thì là xu hướng giảm. Đồng thời, xu hướng giá trong 30 phút qua (6 đường K) được kết hợp để xác nhận xu hướng.
- Phân tích khối lượng: Tính toán khối lượng mua và bán dựa trên biến động giá và phân bổ khối lượng trong mỗi đường K thành khối lượng mua và khối lượng bán theo vị thế giá đóng cửa.
- Tạo tín hiệu giao dịch: Trong xu hướng tăng, tín hiệu mua được tạo ra khi khối lượng mua lớn hơn khối lượng bán; trong xu hướng giảm, tín hiệu bán được tạo ra khi khối lượng bán lớn hơn khối lượng mua.
- Kiểm soát rủi ro: Sử dụng mức dừng lỗ 3% và mục tiêu lợi nhuận 29% để quản lý tỷ lệ rủi ro-lợi nhuận của mỗi giao dịch.
Lợi thế chiến lược
- Xác nhận xu hướng đa chiều: Bằng cách kết hợp đường trung bình động và xu hướng giá ngắn hạn để xác nhận xu hướng gấp đôi, độ chính xác của phán đoán xu hướng được cải thiện.
- Xác minh khối lượng: Giới thiệu phân tích khối lượng như một bộ lọc tín hiệu giao dịch để tránh đột phá sai trong môi trường khối lượng thấp.
- Quản lý rủi ro hoàn hảo: đặt mục tiêu dừng lỗ và lợi nhuận rõ ràng để kiểm soát hiệu quả rủi ro của từng giao dịch.
- Khả năng thích ứng mạnh mẽ: Chiến lược có thể tự động điều chỉnh hướng giao dịch theo tình hình thị trường và thích ứng với các môi trường thị trường khác nhau.
Rủi ro chiến lược
- Rủi ro thị trường biến động: Tín hiệu đột phá sai thường xuyên có thể xảy ra trong thị trường đi ngang và biến động, dẫn đến việc dừng lỗ liên tục.
- Rủi ro trượt giá: Trong giao dịch tần suất cao, bạn có thể phải đối mặt với tình trạng trượt giá lớn, điều này sẽ ảnh hưởng đến hiệu quả thực hiện giao dịch thực tế.
- Độ nhạy của tham số: Hiệu ứng chiến lược nhạy cảm với các tham số như chu kỳ trung bình động và chu kỳ tính toán khối lượng giao dịch.
- Phụ thuộc vào môi trường thị trường: Chiến lược này hoạt động tốt trên thị trường có xu hướng rõ ràng, nhưng có thể bị sụt giảm lớn trong giai đoạn chuyển đổi xu hướng.
Hướng tối ưu hóa chiến lược
- Tối ưu hóa tham số động: Có thể đưa vào cơ chế tham số thích ứng để điều chỉnh động thời gian tính toán khối lượng giao dịch và thời gian tính trung bình động theo biến động của thị trường.
- Tăng cường lọc môi trường thị trường: Thêm các chỉ báo biến động hoặc chỉ báo sức mạnh xu hướng để tự động dừng giao dịch trong điều kiện thị trường không phù hợp.
- Cải thiện cơ chế dừng lỗ: Dừng lỗ động, chẳng hạn như dừng lỗ theo sau hoặc dừng lỗ dựa trên ATR, có thể được sử dụng để tăng tính linh hoạt trong kiểm soát rủi ro.
- Tối ưu hóa logic tạo tín hiệu: Cân nhắc thêm nhiều chỉ báo kỹ thuật hơn để xác thực chéo nhằm cải thiện độ tin cậy của tín hiệu.
Tóm tắt
Chiến lược này xây dựng một hệ thống giao dịch tần suất cao hoàn chỉnh bằng cách kết hợp theo dõi xu hướng và phân tích khối lượng. Ưu điểm chính của chiến lược này nằm ở cơ chế xác nhận tín hiệu đa chiều và hệ thống kiểm soát rủi ro hoàn hảo. Mặc dù có một số rủi ro cố hữu, tính ổn định và khả năng thích ứng của chiến lược có thể được cải thiện hơn nữa thông qua các hướng tối ưu hóa được đề xuất. Chiến lược này đặc biệt phù hợp để hoạt động trong môi trường thị trường có xu hướng rõ ràng và dự kiến sẽ đạt được kết quả giao dịch ổn định thông qua việc tối ưu hóa thông số hợp lý và quản lý rủi ro.
/*backtest
start: 2024-01-10 00:00:00
end: 2025-01-08 08:00:00
period: 1d
basePeriod: 1d
exchanges: [{"eid":"Futures_Binance","currency":"BTC_USDT","balance":49999}]
*/

// This Pine Script™ code is subject to the terms of the Mozilla Public License 2.0 at https://mozilla.org/MPL/2.0/
// © Jerryorange

//@version=6- 1