
Tổng quan
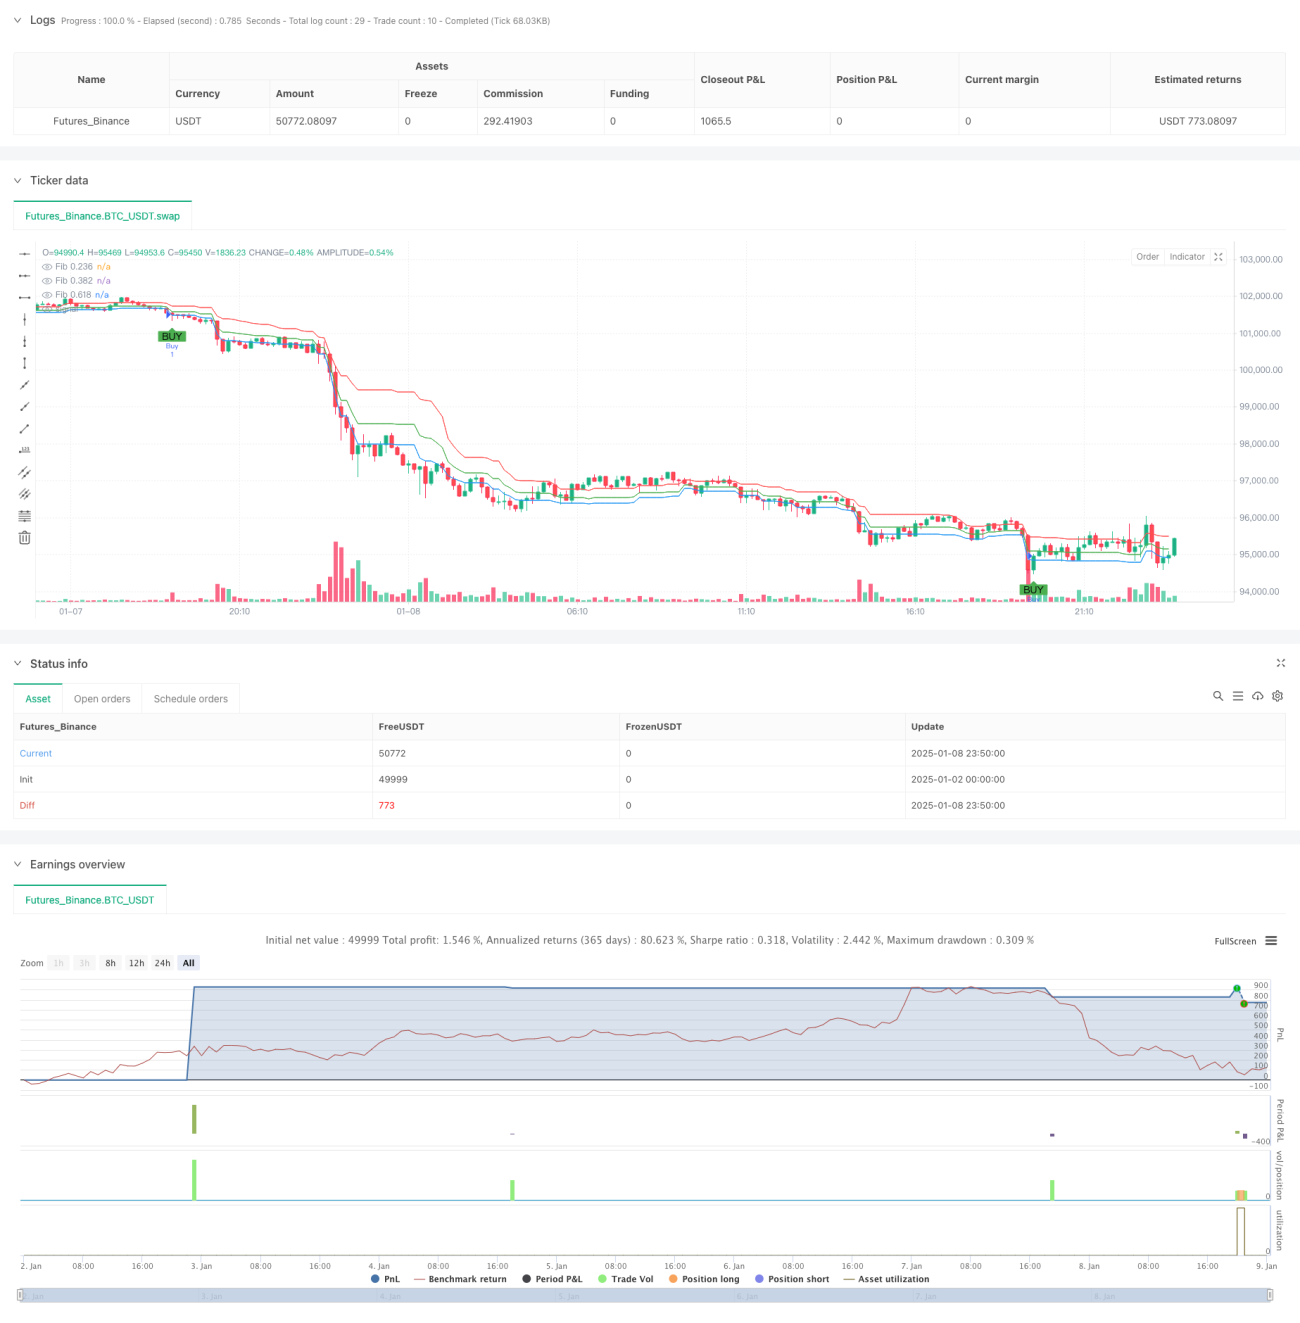
Chiến lược này là hệ thống giao dịch trong ngày kết hợp dải Bollinger và mức thoái lui Fibonacci. Nó sử dụng chỉ báo Bollinger Bands để xác định tình trạng mua quá mức và bán quá mức, đồng thời sử dụng các mức thoái lui Fibonacci để xác nhận các mức hỗ trợ và kháng cự tiềm năng, do đó nắm bắt cơ hội giao dịch khi thị trường biến động. Chiến lược này sử dụng Dải Bollinger 20 kỳ và ba mức Fibonacci chính là 0,236, 0,382 và 0,618 để tạo tín hiệu.
Nguyên tắc chiến lược
Logic cốt lõi của chiến lược này dựa trên các yếu tố chính sau:
- Sử dụng Dải Bollinger trên và dưới (độ lệch chuẩn là 2) để đánh dấu các vùng giá quá mua và quá bán
- Tính toán mức thoái lui Fibonacci bằng cách sử dụng giá cao nhất và thấp nhất của 20 giai đoạn gần nhất
- Tín hiệu mua được tạo ra khi giá vượt qua Dải Bollinger dưới và vượt qua mức hỗ trợ Fibonacci 0,236 hoặc 0,382
- Tín hiệu bán được tạo ra khi giá vượt lên trên Dải Bollinger trên và xuống dưới mức kháng cự Fibonacci 0,618.
- Sử dụng điểm dừng lỗ cố định và điểm chốt lời để kiểm soát rủi ro và khóa lợi nhuận
Lợi thế chiến lược
- Kết hợp với cơ chế xác nhận kép của xu hướng và hỗ trợ và kháng cự, độ tin cậy của tín hiệu giao dịch được cải thiện
- Dải Bollinger có thể thích ứng linh hoạt với những thay đổi trong biến động của thị trường, giúp chiến lược có khả năng thích ứng cao
- Các mức Fibonacci cung cấp một khung tham chiếu rõ ràng cho các mục nhập và thoát
- Cài đặt dừng lỗ và chốt lời cố định giúp kiểm soát chặt chẽ rủi ro
- Các thông số chiến lược có thể được điều chỉnh linh hoạt theo các điều kiện thị trường khác nhau
Rủi ro chiến lược
- Tín hiệu đột phá sai thường xuyên có thể xảy ra trong một thị trường biến động
- Cài đặt dừng lỗ và chốt lời cố định có thể không phù hợp với mọi điều kiện thị trường
- Hiệu quả của các mức Fibonacci bị ảnh hưởng rất nhiều bởi cấu trúc thị trường
- Trong các thị trường có xu hướng nhanh, một số biến động của thị trường có thể bị bỏ lỡ
- Các thông số cần được theo dõi và điều chỉnh liên tục để thích ứng với những thay đổi của thị trường
Hướng tối ưu hóa chiến lược
- Giới thiệu các chỉ báo khối lượng để xác nhận tính hợp lệ của sự đột phá
- Điều chỉnh mức dừng lỗ và chốt lời một cách linh hoạt theo sự biến động của thị trường
- Đã thêm bộ lọc xu hướng để tránh giao dịch ở thị trường đi ngang
- Tối ưu hóa chu kỳ tính toán của các mức Fibonacci
- Hãy cân nhắc thêm bộ lọc thời gian để tránh giao dịch trong thời gian thanh khoản thấp
Tóm tắt
Đây là một hệ thống giao dịch hoàn chỉnh kết hợp các công cụ phân tích kỹ thuật cổ điển, cung cấp cho các nhà giao dịch một khuôn khổ giao dịch có hệ thống thông qua sự kết hợp của Dải Bollinger và Đường thoái lui Fibonacci. Mặc dù có một số hạn chế nhất định, chiến lược này vẫn có thể hiệu quả trong giao dịch trong ngày thông qua việc tối ưu hóa thông số và quản lý rủi ro phù hợp. Điều quan trọng là phải thực hiện những điều chỉnh và tối ưu hóa tương ứng dựa trên các sản phẩm giao dịch và điều kiện thị trường cụ thể.
- 1