Chiến lược theo dõi xu hướng trung bình động và lọc biến động động

Tổng quan
Chiến lược này là một hệ thống giao dịch thông minh kết hợp giữa việc theo dõi xu hướng và lọc biến động. Công cụ này xác định xu hướng thị trường thông qua Đường trung bình động theo hàm mũ (EMA), sử dụng Phạm vi thực (TR) và bộ lọc biến động động để xác định thời điểm vào lệnh và quản lý rủi ro bằng cơ chế dừng lỗ và dừng lãi động dựa trên biến động. Chiến lược này hỗ trợ hai chế độ giao dịch: Scalp và Swing, có thể linh hoạt chuyển đổi tùy theo môi trường thị trường và phong cách giao dịch khác nhau.
Nguyên tắc chiến lược
Logic cốt lõi của chiến lược bao gồm các thành phần chính sau:
- Xác định xu hướng: Sử dụng EMA 50 kỳ làm bộ lọc xu hướng và chỉ mua vào khi giá cao hơn EMA và bán ra khi giá thấp hơn EMA.
- Lọc độ biến động: Tính toán EMA của Phạm vi thực (TR) và sử dụng hệ số lọc có thể điều chỉnh (mặc định là 1,5) để lọc bỏ nhiễu thị trường.
- Điều kiện vào lệnh: Kết hợp với phân tích hình thái của ba đường K liên tiếp, chuyển động giá phải liên tục và tăng tốc.
- Chốt lời và dừng lỗ: Ở chế độ ngắn hạn, lệnh được thiết lập dựa trên TR hiện tại; ở chế độ dải, lệnh được thiết lập dựa trên điểm cao và thấp trước đó để đạt được mục tiêu quản lý rủi ro năng động.
Lợi thế chiến lược
- Khả năng thích ứng mạnh mẽ: Thông qua sự kết hợp giữa tính năng lọc biến động động và theo dõi xu hướng, nó có thể thích ứng với nhiều môi trường thị trường khác nhau.
- Quản lý rủi ro hoàn hảo: Cung cấp cơ chế dừng lỗ và dừng lãi năng động cho hai chế độ giao dịch, có thể linh hoạt lựa chọn theo đặc điểm thị trường.
- Khả năng điều chỉnh tham số tốt: các tham số chính như hệ số lọc, chu kỳ xu hướng, v.v. có thể được tối ưu hóa theo đặc điểm của sản phẩm giao dịch.
- Hiệu ứng trực quan tốt: Cung cấp tín hiệu mua và bán rõ ràng cùng màn hình hiển thị vị trí dừng lãi và dừng lỗ để dễ dàng theo dõi giao dịch.
Rủi ro chiến lược
- Rủi ro đảo ngược xu hướng: có thể xảy ra tình trạng dừng liên tiếp tại các điểm chuyển hướng xu hướng.
- Rủi ro đột phá sai: Tín hiệu sai có thể xuất hiện khi độ biến động đột ngột tăng.
- Độ nhạy tham số: Việc thiết lập hệ số bộ lọc không đúng cách có thể dẫn đến tín hiệu quá nhiều hoặc quá ít.
- Tác động của trượt giá: Trong một thị trường biến động nhanh, bạn có thể phải đối mặt với sự trượt giá lớn, điều này có thể ảnh hưởng đến hiệu quả chiến lược của bạn.
Hướng tối ưu hóa chiến lược
- Thêm tính năng lọc cường độ xu hướng: Có thể đưa các chỉ báo như ADX vào để đánh giá cường độ xu hướng và cải thiện hiệu ứng theo dõi xu hướng.
- Tối ưu hóa mức chốt lời và dừng lỗ: Cân nhắc áp dụng mức dừng lỗ động để bảo vệ nhiều lợi nhuận hơn.
- Cải thiện mô hình giao dịch theo xu hướng: có thể thêm nhiều điều kiện đánh giá cụ thể cho giao dịch theo xu hướng để cải thiện khả năng nắm giữ trung và dài hạn.
- Thêm phân tích khối lượng: Kết hợp các thay đổi về khối lượng để xác nhận tính hợp lệ của đột phá.
Tóm tắt
Chiến lược này xây dựng một hệ thống giao dịch hoàn chỉnh bằng cách kết hợp hữu cơ việc theo dõi xu hướng, lọc biến động và quản lý rủi ro năng động. Ưu điểm của chiến lược này là khả năng thích ứng cao và kiểm soát rủi ro, đồng thời cung cấp nhiều không gian để tối ưu hóa. Bằng cách thiết lập các thông số hợp lý và lựa chọn chế độ giao dịch phù hợp, chiến lược có thể duy trì hiệu suất ổn định trong các môi trường thị trường khác nhau. Nhà giao dịch nên tiến hành kiểm tra ngược và tối ưu hóa thông số đầy đủ trước khi sử dụng thực tế và thực hiện các điều chỉnh tương ứng dựa trên đặc điểm của từng sản phẩm giao dịch cụ thể.
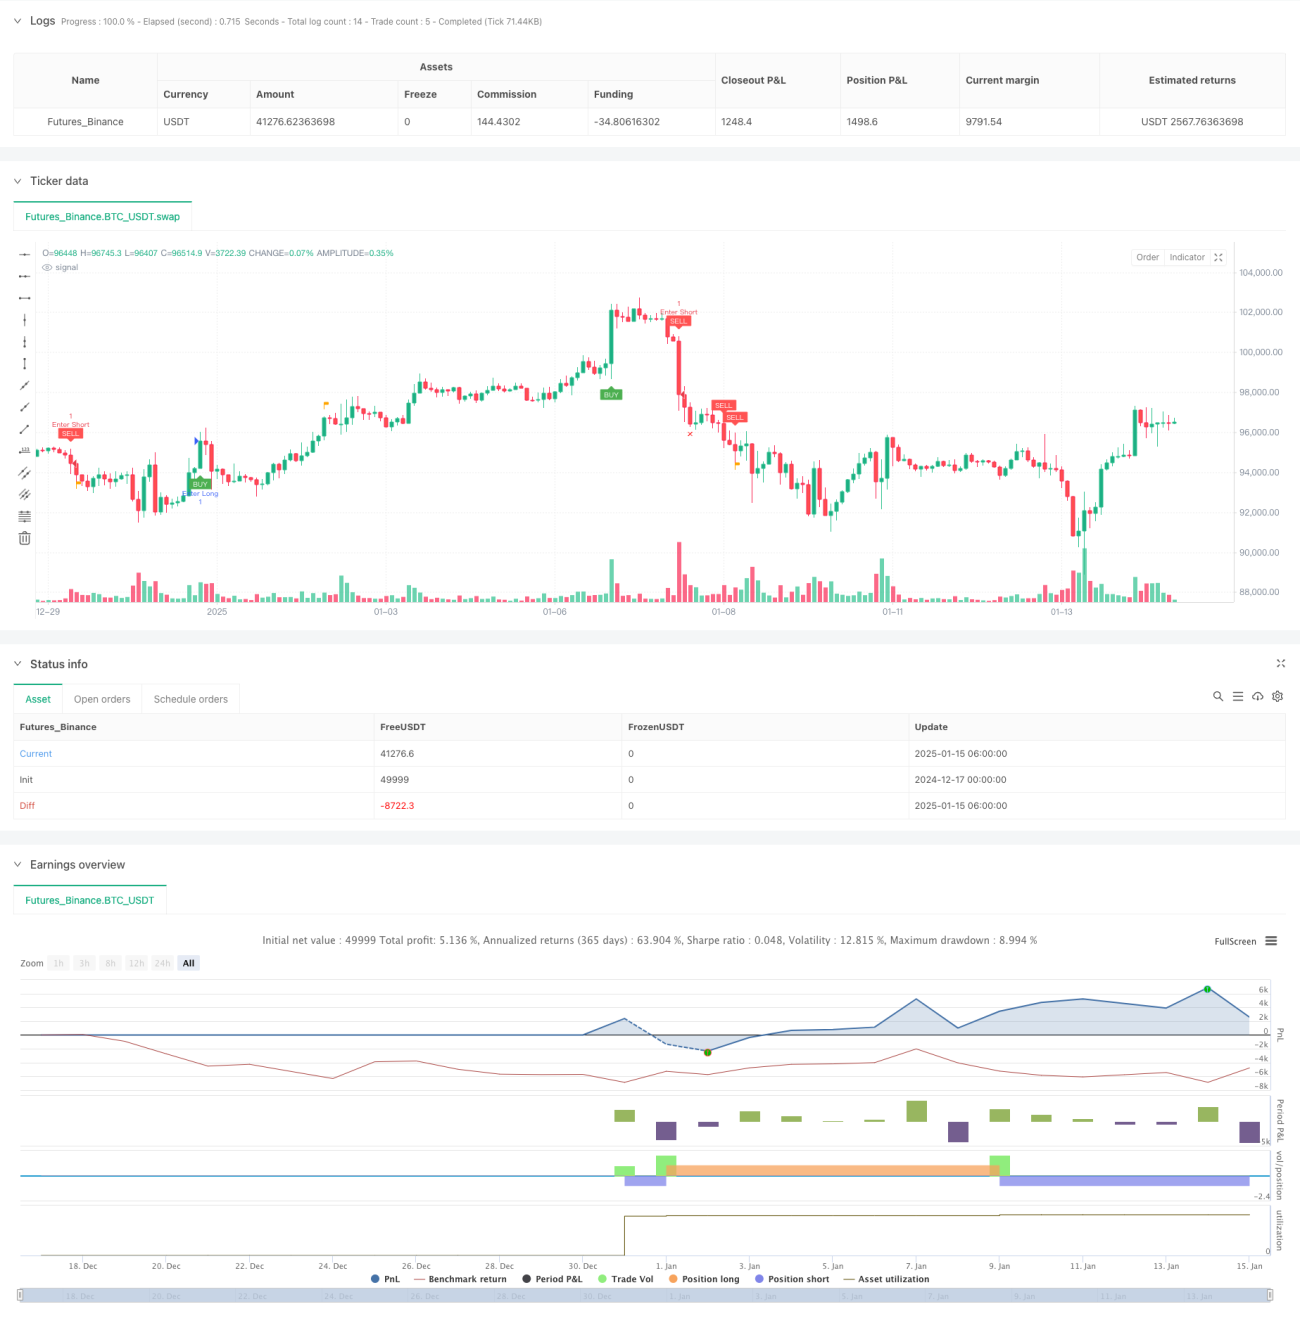
/*backtest
start: 2024-12-17 00:00:00
end: 2025-01-15 08:00:00
period: 2h
basePeriod: 2h
exchanges: [{"eid":"Futures_Binance","currency":"BTC_USDT","balance":49999}]
*/

// This Pine Script™ code is subject to the terms of the Mozilla Public License 2.0 at https://mozilla.org/MPL/2.0/
// © Creativ3mindz

//@version=5- 1