
Tổng quan
Chiến lược này là hệ thống giao dịch siêu xu hướng thích ứng dựa trên máy học. Nó cải thiện độ tin cậy của các chỉ báo SuperTrend truyền thống bằng cách tích hợp cụm biến động, phát hiện xu hướng ATR thích ứng và cơ chế vào và ra có cấu trúc. Cốt lõi của chiến lược này là phân loại sự biến động của thị trường thông qua các phương pháp học máy, thực hiện các giao dịch theo dõi xu hướng trong môi trường thị trường phù hợp và sử dụng lệnh dừng lỗ và chốt lời động để kiểm soát rủi ro.
Nguyên tắc chiến lược
Chiến lược bao gồm ba thành phần chính: 1) Tính toán SuperTrend thích ứng dựa trên ATR để xác định hướng xu hướng và điểm ngoặt; 2) Phân cụm biến động dựa trên thuật toán K-means để phân loại trạng thái thị trường thành ba loại: cao, trung bình và thấp. môi trường biến động ; 3) các quy tắc giao dịch khác nhau dựa trên môi trường biến động. Tìm kiếm cơ hội xu hướng trong môi trường biến động thấp và thận trọng trong môi trường biến động cao. Hệ thống nắm bắt các tín hiệu đảo ngược xu hướng thông qua các hàm ta.crossunder và ta.crossover, và xác định hướng giao dịch dựa trên mối quan hệ vị trí giữa giá và đường SuperTrend.
Lợi thế chiến lược
- Khả năng thích ứng mạnh mẽ: Thông qua các phương pháp học máy, khả năng phán đoán về sự biến động của thị trường được điều chỉnh linh hoạt để chiến lược có thể thích ứng với các môi trường thị trường khác nhau.
- Kiểm soát rủi ro hoàn hảo: Cơ chế dừng lỗ và chốt lời động dựa trên ATR có thể tự động điều chỉnh các thông số kiểm soát rủi ro theo biến động của thị trường.
- Lọc tín hiệu sai: Các tín hiệu sai trong thời kỳ biến động cao sẽ được lọc hiệu quả thông qua các phương pháp phân cụm biến động.
- Phạm vi ứng dụng rộng rãi: Các chiến lược có thể được áp dụng cho nhiều thị trường như ngoại hối, tiền điện tử, cổ phiếu và hàng hóa.
- Áp dụng cho nhiều khoảng thời gian: Có khả năng áp dụng tốt từ nhiều khoảng thời gian khác nhau như 15 phút đến các dòng hàng tháng.
Rủi ro chiến lược
- Độ nhạy của tham số: Việc lựa chọn các tham số như độ dài ATR và hệ số SuperTrend sẽ ảnh hưởng đáng kể đến hiệu suất của chiến lược.
- Rủi ro đảo ngược xu hướng: Sự đảo ngược đột ngột của một xu hướng mạnh có thể dẫn đến sự thoái lui lớn.
- Phụ thuộc vào môi trường thị trường: Giao dịch thường xuyên và chi phí giao dịch tích lũy có thể xảy ra trong một thị trường biến động.
- Độ phức tạp về mặt tính toán: Thành phần học máy làm tăng độ phức tạp về mặt tính toán của chiến lược, điều này có thể ảnh hưởng đến hiệu quả thực hiện theo thời gian thực.
Hướng tối ưu hóa chiến lược
- Tối ưu hóa thuật toán phân cụ biến động: Bạn có thể cân nhắc sử dụng các phương pháp phân cụ tiên tiến hơn như DBSCAN hoặc GMM để cải thiện độ chính xác của phân loại trạng thái thị trường.
- Giới thiệu phân tích nhiều khung thời gian: Kết hợp đánh giá xu hướng dài hạn để cải thiện độ chính xác của hướng giao dịch.
- Điều chỉnh thông số động: Phát triển cơ chế điều chỉnh thông số thích ứng để tự động tối ưu hóa độ dài ATR và hệ số SuperTrend dựa trên hiệu suất thị trường.
- Thêm chỉ báo tâm lý thị trường: Tích hợp các chỉ báo tâm lý thị trường dựa trên khối lượng và động lực giá để cải thiện chất lượng tín hiệu.
- Cải thiện quản lý quỹ: giới thiệu các thuật toán quản lý vị thế phức tạp hơn để tối ưu hóa hiệu quả sử dụng quỹ.
Tóm tắt
Chiến lược này tạo ra một hệ thống thông minh theo dõi xu hướng bằng cách kết hợp các kỹ thuật học máy với các phương pháp phân tích kỹ thuật truyền thống. Ưu điểm cốt lõi của chiến lược này nằm ở khả năng thích ứng và kiểm soát rủi ro, cho phép xác định thông minh các điều kiện thị trường thông qua nhóm biến động. Mặc dù có những rủi ro như độ nhạy của tham số, thông qua quá trình tối ưu hóa và cải tiến liên tục, chiến lược này dự kiến sẽ duy trì hiệu suất ổn định trong nhiều môi trường thị trường khác nhau. Các nhà giao dịch nên kiểm tra đầy đủ độ nhạy của tham số khi áp dụng theo thời gian thực và thực hiện tối ưu hóa có mục tiêu dựa trên các đặc điểm cụ thể của thị trường.
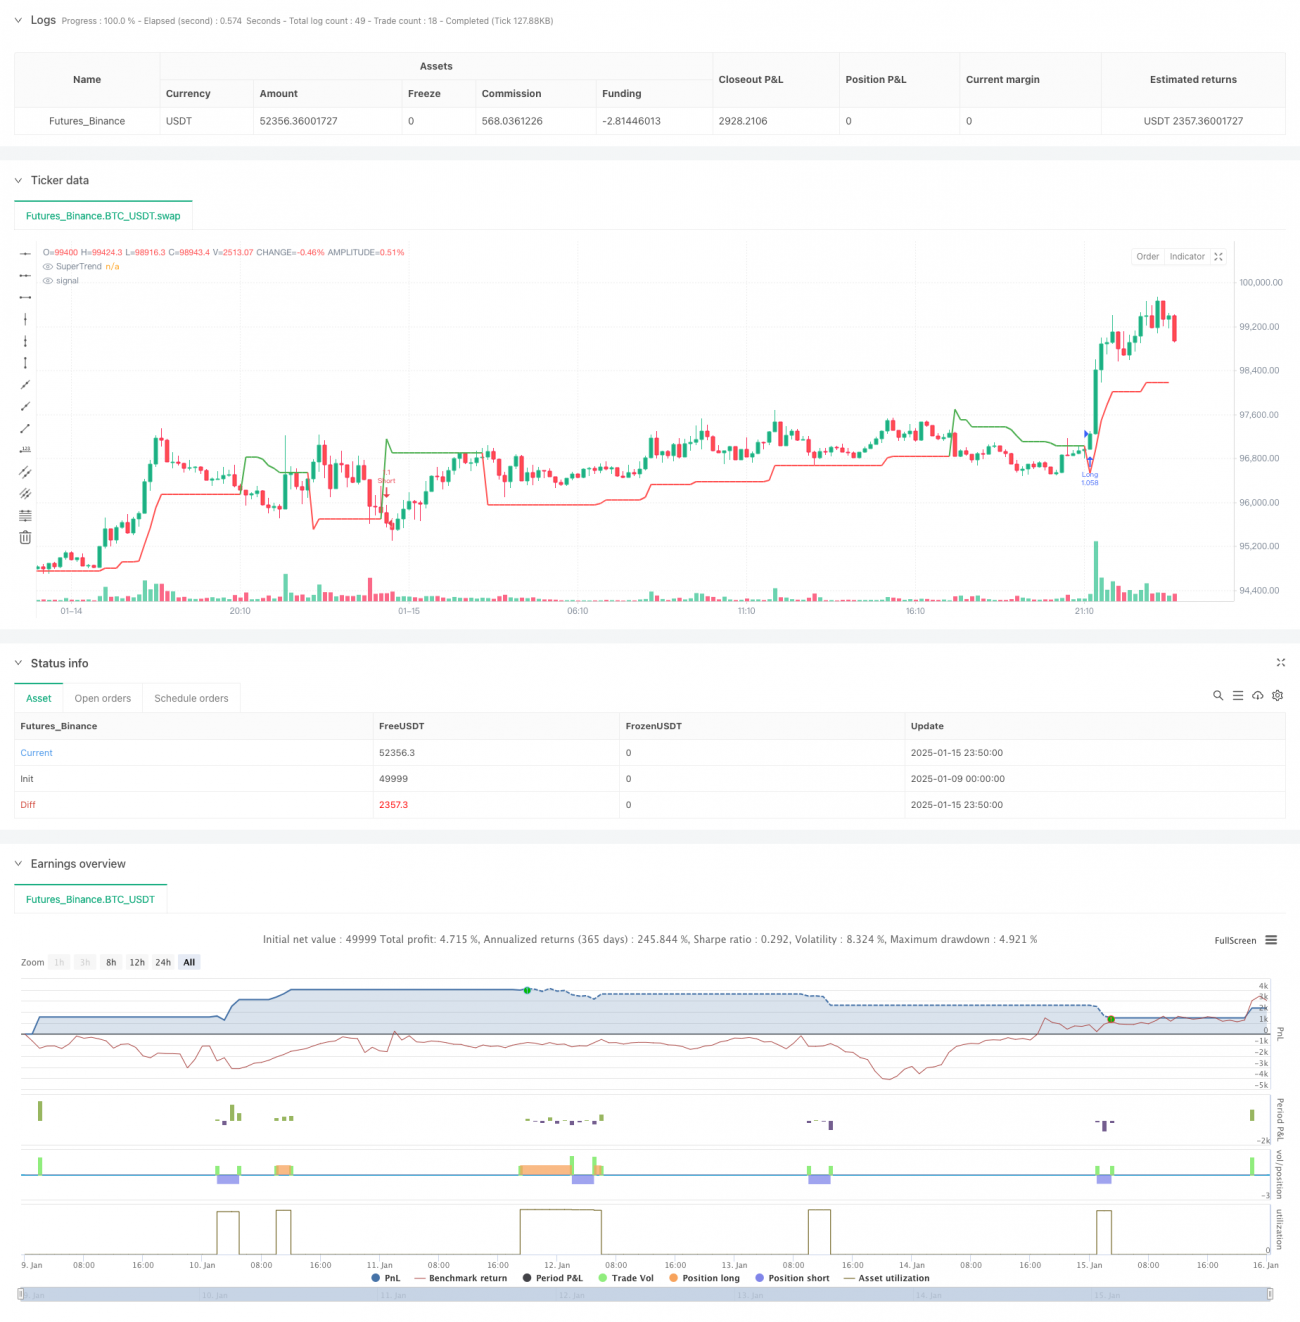
/*backtest
start: 2025-01-09 00:00:00
end: 2025-01-16 00:00:00
period: 10m
basePeriod: 10m
exchanges: [{"eid":"Futures_Binance","currency":"BTC_USDT","balance":49999}]
*/

//@version=5
strategy("Adaptive SuperTrend Strategy", overlay=true, default_qty_type=strategy.percent_of_equity, default_qty_value=200)

// Import Indicator Components- 1