Chiến lược hỗ trợ và kháng cự động nhiều kênh Kenny Channel

KC EMA ATR SMA WMA PP SR
Ngày tạo: 2025-01-17 15:17:59 sửa đổi lần cuối: 2025-01-17 15:17:59
sao chép: 0 Số nhấp chuột: 337
1
tập trung vào
1617
Người theo dõi

Chiến lược hỗ trợ và kháng cự động nhiều kênh Kenny Channel

Tổng quan

Chiến lược này là một hệ thống giao dịch tổng hợp dựa trên Kênh Keltner và các mức hỗ trợ và kháng cự động. Nó tạo thành một khuôn khổ ra quyết định giao dịch hoàn chỉnh bằng cách phân tích nhiều khoảng thời gian và kết hợp các đường trung bình động và chỉ báo biến động. Cốt lõi của chiến lược này là nắm bắt các cơ hội giao dịch có xác suất cao bằng cách xác định thời điểm giá vượt qua các mức kỹ thuật quan trọng trong khi tính đến xu hướng và sự biến động của thị trường.

Nguyên tắc chiến lược

Chiến lược này sử dụng hệ thống chỉ báo kỹ thuật nhiều lớp để phân tích:

  1. Sử dụng kênh Kenny 21 kỳ làm công cụ xác định xu hướng chính và độ rộng kênh được xác định bởi giá trị ATR.
  2. Tính toán các mức hỗ trợ và kháng cự chính bằng cách sử dụng 21 nến bên trái và 8 nến bên phải
  3. Giới thiệu các đường trung bình động thời gian cấp cao như bộ lọc xu hướng
  4. Kết hợp các đường trung bình động ngắn hạn (5 kỳ) và dài hạn (30 kỳ) để xác định thời điểm vào lệnh
  5. Sử dụng ATR để điều chỉnh vị trí dừng lỗ một cách linh hoạt

Lợi thế chiến lược

  1. Các chỉ báo kỹ thuật đa chiều kiểm chứng lẫn nhau và giảm thiểu hiệu quả các tín hiệu sai
  2. Các mức hỗ trợ và kháng cự động được cập nhật theo thời gian thực để thích ứng với những thay đổi của thị trường
  3. Lọc xu hướng thị trường thứ cấp thông qua phân tích thời gian cấp cao
  4. Linh hoạt điều chỉnh các thông số dừng lỗ theo các khoảng thời gian khác nhau
  5. Sử dụng quản lý vị thế phần trăm để kiểm soát rủi ro hiệu quả

Rủi ro chiến lược

  1. Các tín hiệu giao dịch thường xuyên có thể được tạo ra trong một thị trường biến động
  2. Xác minh nhiều chỉ báo có thể dẫn đến việc bỏ lỡ một số cơ hội giao dịch
  3. Tối ưu hóa tham số có nguy cơ quá khớp
  4. Điểm dừng có thể quá rộng trong môi trường biến động cao
  5. Mức hỗ trợ và kháng cự có thể trở nên vô hiệu khi thị trường thay đổi mạnh

Hướng tối ưu hóa chiến lược

  1. Giới thiệu các chỉ số khối lượng để hỗ trợ đánh giá hiệu quả của các đột phá
  2. Thêm mô-đun phân tích biến động thị trường và điều chỉnh các thông số một cách linh hoạt
  3. Tối ưu hóa phương pháp tính toán mức hỗ trợ và kháng cự để nâng cao độ chính xác
  4. Thêm phán đoán về sức mạnh xu hướng và tinh chỉnh các điều kiện nhập cảnh
  5. Cải thiện hệ thống quản lý vị thế để đạt được khả năng kiểm soát rủi ro tinh vi hơn

Tóm tắt

Đây là chiến lược giao dịch định lượng có cấu trúc hoàn chỉnh và logic chặt chẽ. Thông qua việc sử dụng phối hợp nhiều lớp chỉ báo kỹ thuật, độ tin cậy của tín hiệu giao dịch được đảm bảo và kiểm soát rủi ro hiệu quả. Chiến lược này có khả năng mở rộng mạnh mẽ và dự kiến ​​sẽ duy trì hiệu suất ổn định trong các môi trường thị trường khác nhau thông qua quá trình tối ưu hóa và cải tiến liên tục.
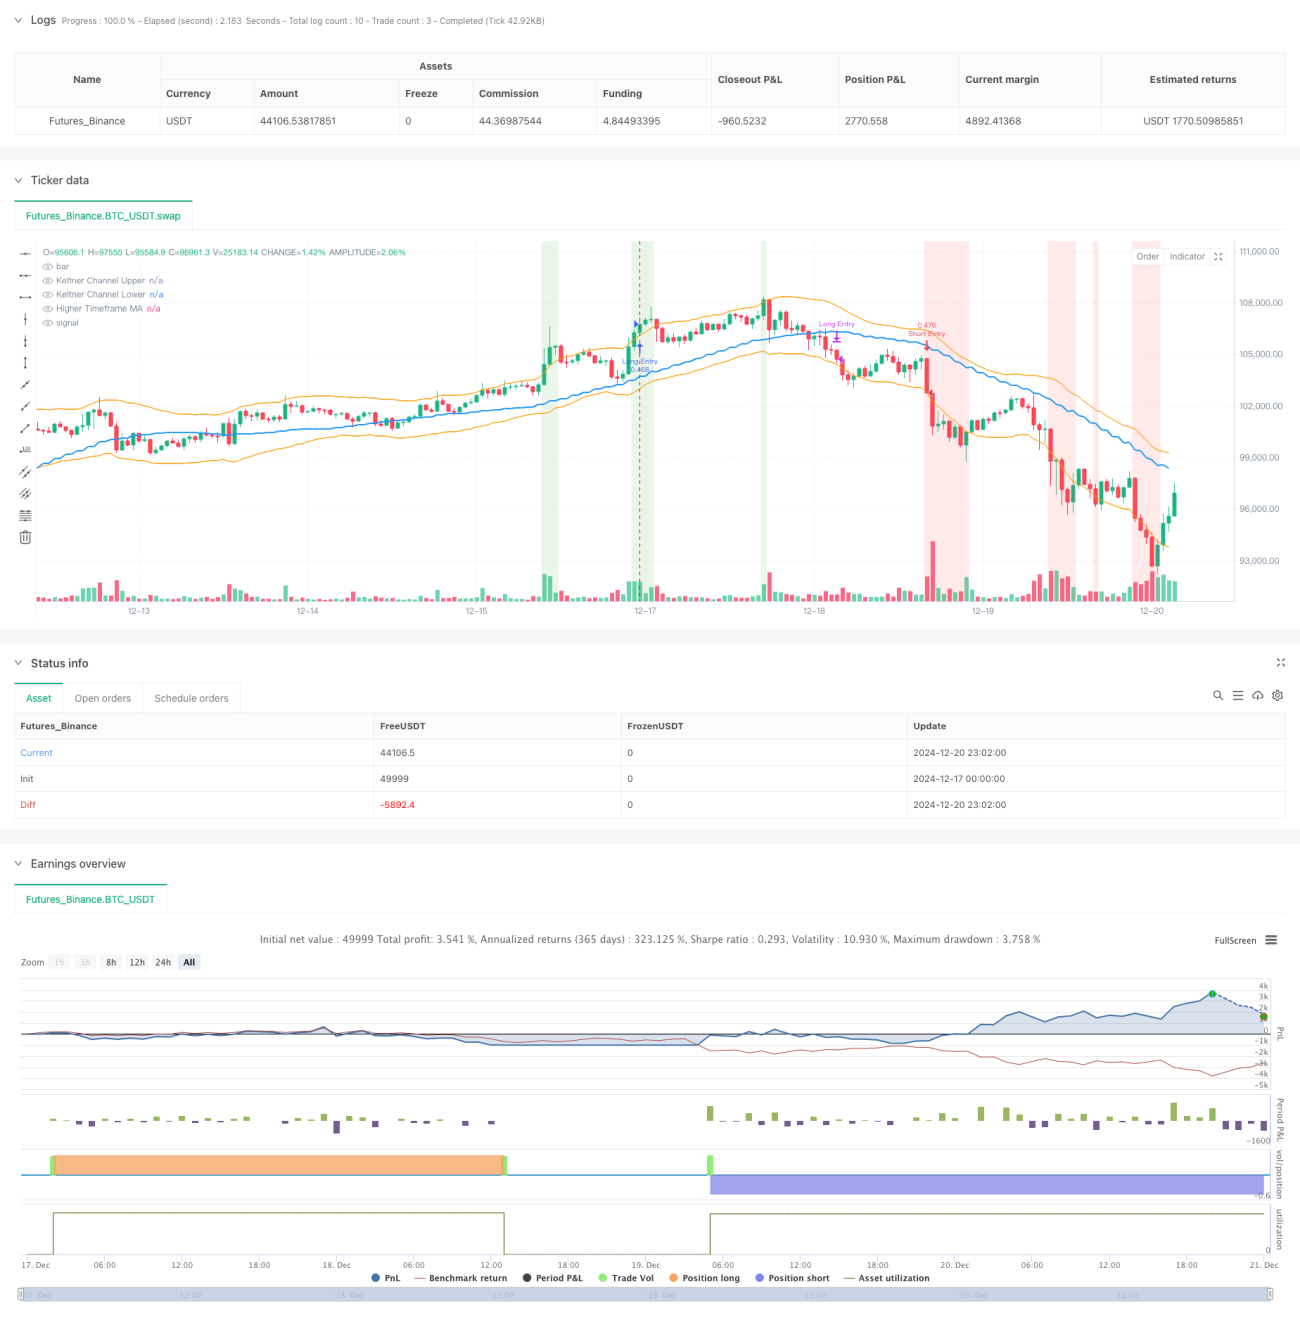
Mã nguồn chiến lược
/*backtest
start: 2024-12-17 00:00:00
end: 2024-12-21 00:00:00
period: 1h
basePeriod: 1h
exchanges: [{"eid":"Futures_Binance","currency":"BTC_USDT","balance":49999}]
*/

// This Pine Script™ code is subject to the terms of the Mozilla Public License 2.0 at https://mozilla.org/MPL/2.0/
// © sathcm
//@version=5 
strategy("KMS", overlay=true, initial_capital=100000, default_qty_type=strategy.percent_of_equity, default_qty_value=100, commission_type=strategy.commission.percent, commission_value=0.05, slippage=3)

// Inputs for Keltner Channels
kcLength = input.int(21, title="Keltner Channel Length", minval=1)  // Length for Keltner Channel calculation
kcMultiplier = input.float(2.0, title="Keltner Channel Multiplier", minval=0.1)  // Multiplier for Keltner Channel width

// Calculate Keltner Channels using best practices
kcBasis = ta.ema(close, kcLength)  // Use EMA for a smoother basis line
atrValue = ta.atr(kcLength)  // Use ATR for channel width calculation
kcUpper = kcBasis + kcMultiplier * atrValue  // Upper Keltner Channel
kcLower = kcBasis - kcMultiplier * atrValue  // Lower Keltner Channel

// Inputs for Pivot Point Calculation
leftBars = input.int(21, title="Left Bars", minval=1)  // Number of bars to the left for pivot calculation
rightBars = input.int(8, title="Right Bars", minval=1, tooltip="Number of bars to the right for pivot calculation")  // Number of bars to the right for pivot calculation

// Calculate Smoothed Pivot Highs and Lows using Weighted Moving Average
pivotHigh = ta.pivothigh(high, leftBars, rightBars)  // Apply WMA for smoothing
pivotLow = ta.pivotlow(low, leftBars, rightBars)  // Apply WMA for smoothing

// Convert Pivot Highs and Lows to Boolean Conditions
isPivotHigh = not na(pivotHigh)  // True when a pivot high exists
isPivotLow = not na(pivotLow)  // True when a pivot low exists

// Get Recent Support and Resistance Levels
recentResistance = ta.valuewhen(isPivotHigh, high, 0)  // Most recent resistance level
recentSupport = ta.valuewhen(isPivotLow, low, 0)  // Most recent support level

// Plot Smoothed Support and Resistance Levels
//plot(recentResistance, color=color.red, title="Recent Resistance", linewidth=2, style=plot.style_line)
//plot(recentSupport, color=color.green, title="Recent Support", linewidth=2, style=plot.style_line)

// Store Entry Price into a Variable
var float entryPrice = na  // Declare a variable to store the entry price

// Input for Higher Timeframe
higherTimeframeInput = input.timeframe('W', title="Higher Timeframe for MA Calculation")

if (timeframe.period == "240") or (timeframe.period == "120")
    higherTimeframeInput := "D"
if (timeframe.period == "60") or (timeframe.period == "30") or (timeframe.period == "15")
    higherTimeframeInput := "120"
if (timeframe.period == "10") or (timeframe.period == "5") 
    higherTimeframeInput := "30"
if (timeframe.period == "1")
    higherTimeframeInput := "10"

prd = input.int(defval=10, title='Pivot Period', minval=4, maxval=30, group='Settings 🔨', tooltip='Used while calculating Pivot Points, checks left&right bars')
ppsrc = input.string(defval='High/Low', title='Source', options=['High/Low', 'Close/Open'], group='Settings 🔨', tooltip='Source for Pivot Points')
ChannelW = input.int(defval=5, title='Maximum Channel Width %', minval=1, maxval=8, group='Settings 🔨', tooltip='Calculated using Highest/Lowest levels in 300 bars')
minstrength = input.int(defval=1, title='Minimum Strength', minval=1, group='Settings 🔨', tooltip='Channel must contain at least 2 Pivot Points')
maxnumsr = input.int(defval=4, title='Maximum Number of S/R', minval=1, maxval=10, group='Settings 🔨', tooltip='Maximum number of Support/Resistance Channels to Show') - 1
loopback = input.int(defval=150, title='Loopback Period', minval=100, maxval=400, group='Settings 🔨', tooltip='While calculating S/R levels it checks Pivots in Loopback Period')
res_col = input.color(defval=color.new(color.red, 75), title='Resistance Color', group='Colors 🟡🟢🟣')
sup_col = input.color(defval=color.new(color.lime, 75), title='Support Color', group='Colors 🟡🟢🟣')
inch_col = input.color(defval=color.new(color.gray, 75), title='Color When Price in Channel', group='Colors 🟡🟢🟣')

// Get Pivot High/Low
src1 = ppsrc == 'High/Low' ? high : math.max(close, open)
src2 = ppsrc == 'High/Low' ? low : math.min(close, open)
ph = ta.pivothigh(src1, prd, prd)
pl = ta.pivotlow(src2, prd, prd)

// Calculate maximum S/R channel width
prdhighest = ta.highest(300)
prdlowest = ta.lowest(300)
cwidth = (prdhighest - prdlowest) * ChannelW / 100

// Get/keep Pivot levels
var pivotvals = array.new_float(0)
var pivotlocs = array.new_float(0)
if ph or pl
    array.unshift(pivotvals, ph ? ph : pl)
    array.unshift(pivotlocs, bar_index)
    for x = array.size(pivotvals) - 1 to 0 by 1
        if bar_index - array.get(pivotlocs, x) > loopback  // remove old pivot points
            array.pop(pivotvals)
            array.pop(pivotlocs)
            continue
        break

// Find/create SR channel of a pivot point
get_sr_vals(ind) =>
    float lo = array.get(pivotvals, ind)
    float hi = lo
    int numpp = 0
    for y = 0 to array.size(pivotvals) - 1 by 1
        float cpp = array.get(pivotvals, y)
        float wdth = cpp <= hi ? hi - cpp : cpp - lo
        if wdth <= cwidth  // fits the max channel width?
            if cpp <= hi
                lo := math.min(lo, cpp)
            else
                hi := math.max(hi, cpp)
            numpp += 20  // each pivot point added as 20
    [hi, lo, numpp]

// Keep old SR channels and calculate/sort new channels if we met new pivot point
var suportresistance = array.new_float(20, 0)  // min/max levels
changeit(x, y) =>
    tmp = array.get(suportresistance, y * 2)
    array.set(suportresistance, y * 2, array.get(suportresistance, x * 2))
    array.set(suportresistance, x * 2, tmp)
    tmp := array.get(suportresistance, y * 2 + 1)
    array.set(suportresistance, y * 2 + 1, array.get(suportresistance, x * 2 + 1))
    array.set(suportresistance, x * 2 + 1, tmp)

if ph or pl
    supres = array.new_float(0)  // number of pivot, strength, min/max levels
    stren = array.new_float(10, 0)
    // Get levels and strengths
    for x = 0 to array.size(pivotvals) - 1 by 1
        [hi, lo, strength] = get_sr_vals(x)
        array.push(supres, strength)
        array.push(supres, hi)
        array.push(supres, lo)

    // Add each HL to strength
    for x = 0 to array.size(pivotvals) - 1 by 1
        h = array.get(supres, x * 3 + 1)
        l = array.get(supres, x * 3 + 2)
        s = 0
        for y = 0 to loopback by 1
            if high[y] <= h and high[y] >= l or low[y] <= h and low[y] >= l
                s += 1
        array.set(supres, x * 3, array.get(supres, x * 3) + s)

    // Reset SR levels
    array.fill(suportresistance, 0)
    // Get strongest SRs
    src = 0
    for x = 0 to array.size(pivotvals) - 1 by 1
        stv = -1.  // value
        stl = -1  // location
        for y = 0 to array.size(pivotvals) - 1 by 1
            if array.get(supres, y * 3) > stv and array.get(supres, y * 3) >= minstrength * 20
                stv := array.get(supres, y * 3)
                stl := y
        if stl >= 0
            // Get SR level
            hh = array.get(supres, stl * 3 + 1)
            ll = array.get(supres, stl * 3 + 2)
            array.set(suportresistance, src * 2, hh)
            array.set(suportresistance, src * 2 + 1, ll)
            array.set(stren, src, array.get(supres, stl * 3))

            // Make included pivot points' strength zero
            for y = 0 to array.size(pivotvals) - 1 by 1
                if array.get(supres, y * 3 + 1) <= hh and array.get(supres, y * 3 + 1) >= ll or array.get(supres, y * 3 + 2) <= hh and array.get(supres, y * 3 + 2) >= ll
                    array.set(supres, y * 3, -1)

            src += 1
            if src >= 10
                break

    for x = 0 to 8 by 1
        for y = x + 1 to 9 by 1
            if array.get(stren, y) > array.get(stren, x)
                tmp = array.get(stren, y)
                array.set(stren, y, array.get(stren, x))
                changeit(x, y)

get_level(ind) =>
    float ret = na
    if ind < array.size(suportresistance)
        if array.get(suportresistance, ind) != 0
            ret := array.get(suportresistance, ind)
    ret

get_color(ind) =>
    color ret = na
    if ind < array.size(suportresistance)
        if array.get(suportresistance, ind) != 0
            ret := array.get(suportresistance, ind) > close and array.get(suportresistance, ind + 1) > close ? res_col : array.get(suportresistance, ind) < close and array.get(suportresistance, ind + 1) < close ? sup_col : inch_col
    ret

// var srchannels = array.new_box(10)
// for x = 0 to math.min(9, maxnumsr) by 1
//     box.delete(array.get(srchannels, x))
//     srcol = get_color(x * 2)
//     if not na(srcol)
//         array.set(srchannels, x, box.new(left=bar_index, top=get_level(x * 2), right=bar_index + 1, bottom=get_level(x * 2 + 1), border_color=srcol, border_width=1, extend=extend.both, bgcolor=srcol))

// Improved dynamic support detection
float recentSupport1 = na
float previousSupport = na
float currentsupport = na

if na(previousSupport) or currentsupport != previousSupport
    if array.size(suportresistance) > 1 
        for i = 0 to math.floor(array.size(suportresistance) / 2) - 1  // Iterate through support levels
            currentsupport := array.get(suportresistance, i * 2 + 1)  // Support is stored at odd indices
            if currentsupport < close and (na(recentSupport1) or math.abs(close - currentsupport) < math.abs(close - recentSupport1))
                previousSupport := currentsupport  // Store the newly detected support
                  // Set the most recent support to the new support
                recentSupport1 := na(recentSupport1) ? ta.lowest(low, 10) : currentsupport
// Moving averages for entry and exit
maShort = ta.sma(close, 5)
maLong = ta.sma(close, 30) + ta.atr(14)
// Track entry price
entryPrice1 = strategy.position_avg_price  // Get the price of the currently open position
currentTimeFrame = timeframe.period
exitPrice = entryPrice1 * 0.99

if currentTimeFrame == "1H" or currentTimeFrame == "30" or currentTimeFrame == "15" or currentTimeFrame == "5"
    exitPrice := entryPrice1 * 0.99  // Set the exit price at 99% of the entry price

if currentTimeFrame == "120" or currentTimeFrame == "180" or currentTimeFrame == "240" or currentTimeFrame == "D"
    exitPrice := entryPrice1 * 0.98 // Set the exit price at 95% of the entry price


// Calculate Moving Average based on higher timeframe for length of 20 bars
higherTimeframeMA = request.security(syminfo.tickerid, higherTimeframeInput, ta.sma(close, 20), barmerge.gaps_off, barmerge.lookahead_on)  // Calculate MA with adjusted timeframe

// Entry and Exit Conditions for Long
entryLong = (close > kcUpper) and (close > recentResistance) and (close > higherTimeframeMA)  // Long entry when price breaks above KC upper, recent resistance, and higher timeframe MA
exitLong = (close < recentResistance - 1.5*atrValue)  // Long exit when price falls below recent resistance with cushion of one ATR

// Entry and Exit Conditions for Short
entryShort = (close < kcLower) and (close < recentSupport) and (close < higherTimeframeMA+atrValue) // Add RSI filter to reduce false signals by confirming momentum  // Short entry when price breaks below KC lower, recent support, and higher timeframe MA
exitShort = (close > recentSupport + atrValue)  // Short exit when price rises above recent support with cushion of one ATR(close > recentSupport + atrValue)  // Short exit when price rises above recent support with cushion of one ATR(close > recentSupport + atrValue)  // Short exit when price rises above recent support with cushion of one ATR

// Strategy Execution for Long
if not na(recentSupport1) and (close <= recentSupport1 +(close*0.01) or close >= recentSupport1 - (close*0.0075)) and (maShort > maLong) and entryLong
    strategy.entry("Long Entry", strategy.long)
    //entryPrice := strategy.position_avg_price  // Store the entry price when a position is opened

if ((maShort < maLong + 3*ta.atr(14)) or  close < exitPrice) and exitLong
    strategy.close("Long Entry")

// Strategy Execution for Short
if entryShort
    strategy.entry("Short Entry", strategy.short)
    entryPrice := strategy.position_avg_price  // Store the entry price when a position is opened

if exitShort
    strategy.close("Short Entry")

// Plot Keltner Channels
plot(kcUpper, color=color.orange, title="Keltner Channel Upper", linewidth=1)
plot(kcLower, color=color.orange, title="Keltner Channel Lower", linewidth=1)

// Plot Moving Averages
plot(higherTimeframeMA, color=color.blue, title="Higher Timeframe MA", linewidth=2)

//plot(recentSupport1, color=#04313f, title="Recent Support1")
//plot(recentResistance, color=color.purple, title="Recent Resistance")
//plot(entryPrice1, color=color.lime, title="Entry Price 1")
//plot(exitPrice, color=color.maroon, title="Exit Price")
//plot(maShort, color=color.green, title="MA Short")
//plot(maLong, color=color.blue, title="MA Long Plus ATR")

// Highlight Entry Zones
bgcolor(entryLong ? color.new(color.green, 85) : na, title="Long Entry Zone")
bgcolor(entryShort ? color.new(color.red, 85) : na, title="Short Entry Zone")

// Alerts
alertcondition(entryLong, title="Long Entry", message="Price broke above the Keltner Channel and recent resistance for Long Entry")
alertcondition(exitLong, title="Long Exit", message="Price fell below recent resistance with cushion of one ATR - Long Exit")
alertcondition(entryShort, title="Short Entry", message="Price broke below the Keltner Channel and recent support for Short Entry")
alertcondition(exitShort, title="Short Exit", message="Price rose above recent support with cushion of one ATR - Short Exit")