Hệ thống chuyển mạch động đa chiến lược thích ứng: một chiến lược giao dịch định lượng tích hợp theo dõi xu hướng và dao động phạm vi

Tổng quan
Chiến lược này là một hệ thống giao dịch thích ứng tích hợp nhiều chỉ báo phân tích kỹ thuật và chuyển đổi giữa các chiến lược giao dịch khác nhau bằng cách xác định động các điều kiện thị trường. Hệ thống chủ yếu dựa trên ba chỉ báo kỹ thuật: đường trung bình động (MA), Dải Bollinger (BB) và Chỉ số sức mạnh tương đối (RSI), tự động lựa chọn phương pháp giao dịch phù hợp nhất theo xu hướng thị trường và biến động phạm vi. Chiến lược này áp dụng các giải pháp quản lý rủi ro khác biệt cho thị trường xu hướng và phạm vi bằng cách thiết lập các thông số chốt lời và dừng lỗ khác nhau.
Nguyên tắc chiến lược
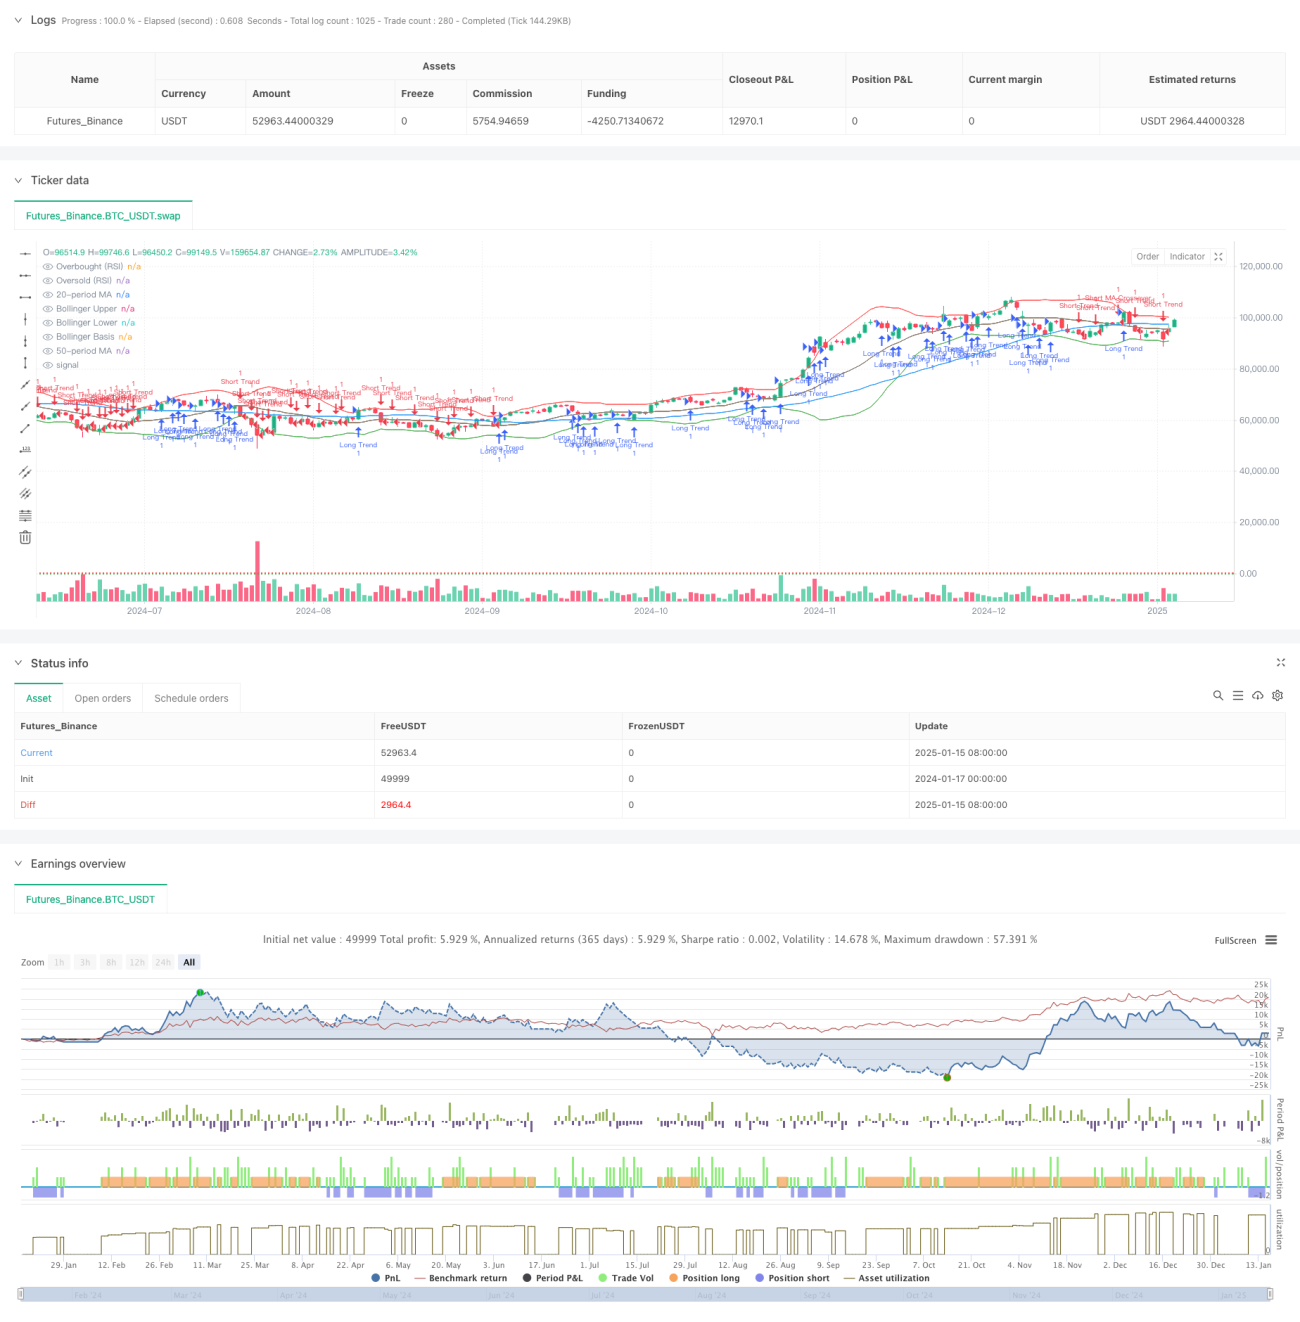
Chiến lược này sử dụng đường trung bình động 50 kỳ và 20 kỳ để xác định xu hướng thị trường và kết hợp dải Bollinger và chỉ báo RSI để xác định vùng quá mua và quá bán. Trong một thị trường có xu hướng, hệ thống giao dịch chủ yếu dựa trên mối quan hệ giữa giá và đường trung bình động chậm và sự giao nhau của các đường nhanh và chậm; trong một thị trường phạm vi, nó giao dịch chủ yếu dựa trên sự đột phá ranh giới của Dải Bollinger và các tín hiệu mua quá mức và bán quá mức của RSI . Hệ thống tự động điều chỉnh mức chốt lời theo môi trường thị trường. Mức chốt lời 6% được sử dụng cho thị trường có xu hướng và mức chốt lời 4% được sử dụng cho thị trường phạm vi. Mức dừng lỗ 2% được sử dụng đồng đều để kiểm soát rủi ro.
Lợi thế chiến lược
- Khả năng thích ứng thị trường mạnh mẽ: Khả năng tự động chuyển đổi chiến lược giao dịch theo các môi trường thị trường khác nhau để cải thiện tính ổn định của hệ thống
- Quản lý rủi ro được cải thiện: các tỷ lệ chốt lời khác nhau được sử dụng cho các điều kiện thị trường theo xu hướng và phạm vi, phù hợp hơn với đặc điểm thị trường
- Xác minh tín hiệu đa chiều: Cải thiện độ tin cậy của tín hiệu giao dịch thông qua việc xác minh chéo nhiều chỉ báo kỹ thuật
- Mức độ tự động hóa cao: hoạt động hoàn toàn tự động, không cần can thiệp thủ công, giảm thiểu lỗi do phán đoán chủ quan
Rủi ro chiến lược
- Độ nhạy của tham số: Việc lựa chọn nhiều tham số chỉ báo kỹ thuật sẽ ảnh hưởng đến hiệu suất chiến lược và yêu cầu tối ưu hóa tham số đầy đủ
- Độ trễ chuyển đổi thị trường: Có thể có độ trễ trong việc đánh giá tình trạng thị trường, điều này ảnh hưởng đến hiệu suất của chiến lược.
- Rủi ro tín hiệu sai: Tín hiệu giao dịch sai có thể được tạo ra trên thị trường biến động
- Cân nhắc về chi phí giao dịch: Việc chuyển đổi chiến lược thường xuyên có thể dẫn đến chi phí giao dịch cao hơn
Hướng tối ưu hóa chiến lược
- Giới thiệu các chỉ báo khối lượng: Thêm phân tích khối lượng vào các chỉ báo kỹ thuật hiện có để cải thiện độ tin cậy của tín hiệu
- Tối ưu hóa phán đoán tình trạng thị trường: Cân nhắc giới thiệu các chỉ báo sức mạnh xu hướng như ATR và ADX để cải thiện độ chính xác của phán đoán tình trạng thị trường
- Điều chỉnh tham số động: tự động điều chỉnh các tham số dừng lỗ và dừng lãi theo biến động của thị trường để cải thiện khả năng thích ứng của chiến lược
- Tăng cường cơ chế lọc: thiết kế các điều kiện giao dịch chặt chẽ hơn để giảm tín hiệu sai
Tóm tắt
Chiến lược này tích hợp nhiều chỉ báo kỹ thuật cổ điển để xây dựng một hệ thống giao dịch có khả năng thích ứng với nhiều môi trường thị trường khác nhau. Trong khi vẫn giữ cho hoạt động đơn giản, hệ thống thực hiện nhận dạng động trạng thái thị trường và tự động chuyển đổi chiến lược giao dịch, có tính thực tiễn cao. Thông qua các thiết lập chốt lời và dừng lỗ khác biệt, chiến lược này duy trì lợi nhuận tốt trong khi vẫn kiểm soát được rủi ro. Trong tương lai, tính ổn định và độ tin cậy của chiến lược có thể được cải thiện hơn nữa bằng cách đưa ra nhiều chỉ số kỹ thuật hơn và tối ưu hóa cơ chế điều chỉnh tham số.
- 1