Chiến lược sức mạnh động lượng xu hướng RSI hai giai đoạn kết hợp với hệ thống quản lý vị thế kim tự tháp

Tổng quan
Chiến lược này là hệ thống giao dịch theo xu hướng dựa trên RSI (Chỉ số sức mạnh tương đối) hai giai đoạn kết hợp với quản lý vị thế theo kiểu kim tự tháp. Chiến lược này so sánh các chỉ báo RSI của hai giai đoạn khác nhau (14 và 30), can thiệp vào đầu xu hướng và tăng vị thế thông qua lệnh giới hạn khi xu hướng tiếp tục, do đó tối đa hóa khả năng nắm bắt xu hướng. Hệ thống được thiết kế với cơ chế kiểm soát rủi ro hoàn chỉnh, bao gồm quản lý vị thế và điều kiện thanh lý động.
Nguyên tắc chiến lược
Chiến lược này sử dụng tín hiệu giao nhau RSI hai giai đoạn làm điều kiện kích hoạt giao dịch và kết hợp với quản lý vị thế theo kiểu kim tự tháp. Cụ thể:
- Tín hiệu vào lệnh: Sử dụng RSI 14 kỳ để phá vỡ mức quá bán (30) và quá mua (70) làm tín hiệu mở vị thế
- Quản lý tăng vị thế: Sau khi mở một vị thế, có thể đạt được mức tăng vị thế thứ hai bằng cách đặt lệnh giới hạn với độ lệch giá là 1,5%
- Tín hiệu đóng: Sử dụng RSI 30 chu kỳ làm chỉ báo đóng và kích hoạt đóng khi RSI giảm từ vùng quá mua hoặc phục hồi từ vùng quá bán
- Kiểm soát vị trí: Hệ thống cho phép tối đa hai vị trí (hình chóp = 2) và số lượng vị trí mở mỗi lần có thể được thiết lập độc lập
Lợi thế chiến lược
- Khả năng nắm bắt xu hướng mạnh mẽ: Thông qua sự hợp tác của RSI hai giai đoạn, có thể xác định và theo dõi tốt hơn các xu hướng trung và dài hạn.
- Tối ưu hóa tỷ lệ rủi ro-lợi nhuận: áp dụng chiến lược tăng vị thế theo kiểu kim tự tháp để khuếch đại lợi nhuận bằng cách tăng vị thế sau khi xu hướng được thiết lập
- Quản lý vị thế linh hoạt: số lượng vị thế mở và tăng có thể được điều chỉnh theo điều kiện thị trường và khối lượng vốn
- Thiết kế dừng lỗ động: Sử dụng RSI dài hạn làm chỉ báo đóng vị thế để tránh thoát lệnh sớm
- Khả năng điều chỉnh thông số mạnh mẽ: các thông số chính có thể được tối ưu hóa và điều chỉnh theo các đặc điểm khác nhau của thị trường
Rủi ro chiến lược
- Rủi ro thị trường biến động: Việc vào và thoát thường xuyên trong một thị trường có phạm vi có thể dẫn đến thua lỗ
- Rủi ro trượt giá: Lệnh tăng vị thế được thực hiện bằng lệnh giới hạn và thời điểm tốt nhất để tăng vị thế có thể bị bỏ lỡ trong thị trường biến động.
- Rủi ro quản lý quỹ: việc tăng gấp đôi vị thế của bạn có thể dẫn đến mức giảm lớn hơn
- Rủi ro đảo ngược xu hướng: Chỉ báo RSI có độ trễ nhất định và bạn có thể không kịp dừng lỗ khi xu hướng đảo ngược.
- Rủi ro tối ưu hóa tham số: Tối ưu hóa quá mức có thể khiến chiến lược hoạt động kém hiệu quả trong giao dịch thực tế.
Hướng tối ưu hóa chiến lược
- Giới thiệu bộ lọc xu hướng: Bạn có thể thêm các chỉ báo xu hướng như đường trung bình động hoặc ADX để cải thiện độ tin cậy của tín hiệu vào lệnh
- Tối ưu hóa quản lý vị thế: Bạn có thể thiết kế hệ thống quản lý vị thế động để điều chỉnh số lượng vị thế mở theo mức độ biến động
- Cải thiện cơ chế dừng lỗ: cân nhắc thêm lệnh dừng lỗ theo sau hoặc giải pháp dừng lỗ dựa trên ATR
- Tăng cường lọc môi trường thị trường: giới thiệu các chỉ số biến động và điều chỉnh các thông số chiến lược trong các môi trường thị trường khác nhau
- Logic cải tiến để thêm vị thế: độ lệch của giá thêm vị thế có thể được điều chỉnh linh hoạt dựa trên sự biến động
Tóm tắt
Chiến lược này nắm bắt tốt xu hướng thông qua sự kết hợp giữa RSI hai giai đoạn và phương pháp thêm vị thế theo kiểu kim tự tháp. Chiến lược này thiết kế một hệ thống giao dịch hoàn chỉnh, bao gồm các yếu tố chính như điểm vào lệnh, tăng vị thế, dừng lỗ và quản lý vị thế. Thông qua việc tối ưu hóa tham số và cải thiện quản lý rủi ro, chiến lược này dự kiến sẽ đạt được hiệu suất ổn định trong giao dịch thực tế. Các nhà giao dịch nên kiểm tra và điều chỉnh đầy đủ các thông số theo đặc điểm cụ thể của thị trường trước khi sử dụng chúng vào giao dịch thực tế.
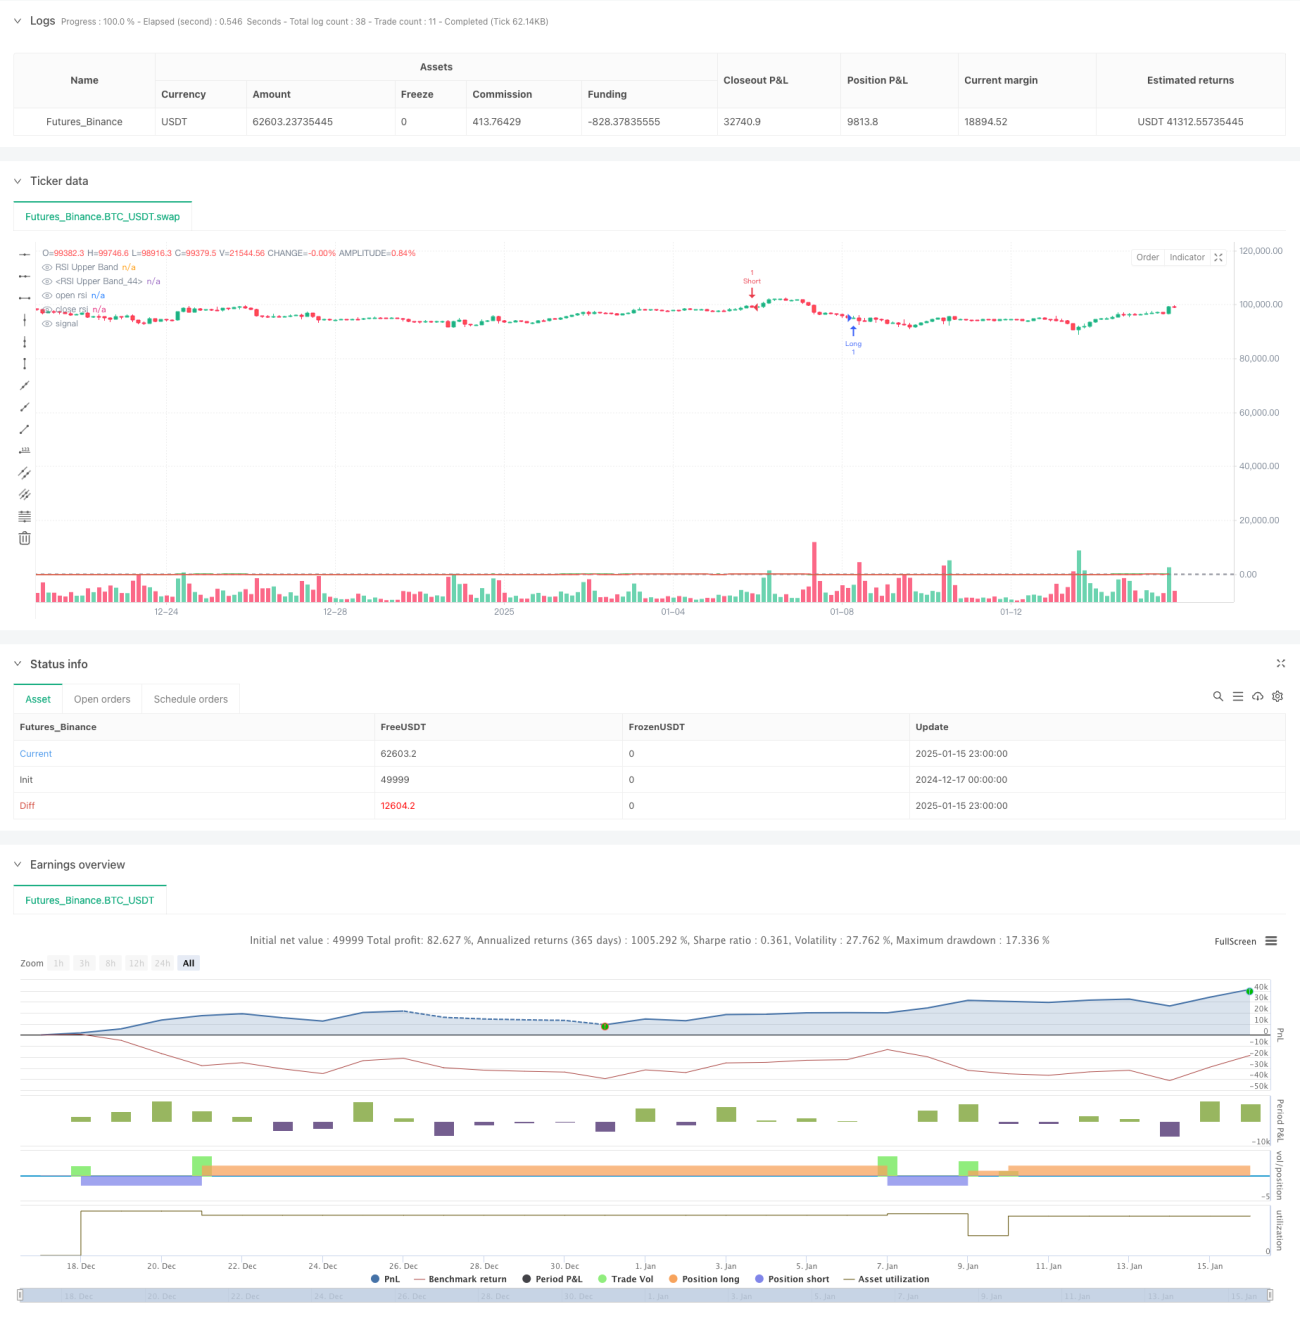
/*backtest
start: 2024-12-17 00:00:00
end: 2025-01-16 00:00:00
period: 3h
basePeriod: 3h
exchanges: [{"eid":"Futures_Binance","currency":"BTC_USDT","balance":49999}]
*/

//@version=5
strategy("RSI Top Strategy", overlay=true, pyramiding=2)

qty1 = input( 1 , "Qty first entry", group="Strategy settings")- 1