Nhiều chỉ báo kỹ thuật giao nhau theo xu hướng động lượng chiến lược sau

Tổng quan
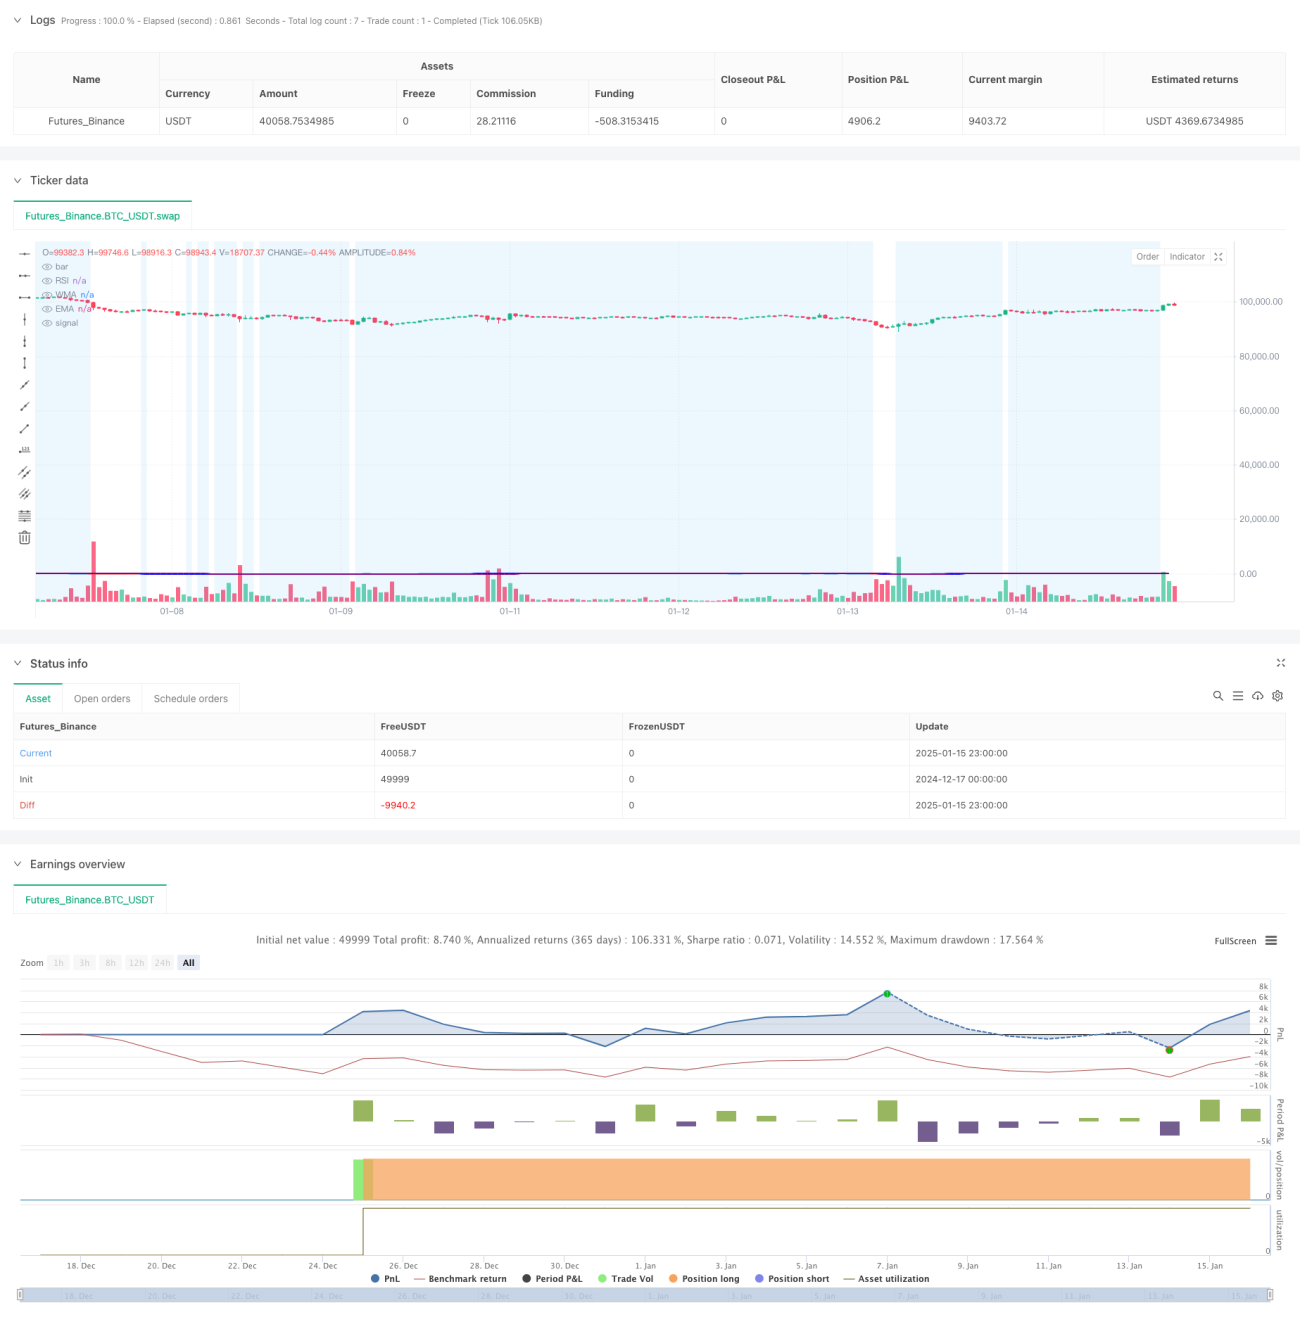
Chiến lược này là một hệ thống giao dịch theo xu hướng kết hợp Chỉ số sức mạnh tương đối (RSI), Đường trung bình động có trọng số (WMA) và Đường trung bình động theo hàm mũ (EMA). Chiến lược này sử dụng nhiều chỉ báo kỹ thuật phối hợp để nắm bắt những thay đổi trong động lực thị trường tại các điểm chuyển hướng xu hướng, từ đó tạo ra các tín hiệu giao dịch. Hệ thống sử dụng đường chéo WMA và EMA để xác nhận hướng xu hướng và kết hợp chỉ báo RSI để lọc trạng thái thị trường nhằm nâng cao độ chính xác của giao dịch.
Nguyên tắc chiến lược
Logic cốt lõi của chiến lược này dựa trên các yếu tố chính sau:
- Chỉ báo RSI được tính toán bằng chu kỳ 14 ngày để đo lường tình trạng mua quá mức và bán quá mức của thị trường.
- Sự giao nhau giữa WMA 45 kỳ và EMA 89 kỳ được sử dụng để xác nhận sự thay đổi trong xu hướng.
- Điều kiện tham gia:
- Tín hiệu dài hạn: WMA cắt lên trên EMA và RSI < 50
- Tín hiệu ngắn: WMA cắt xuống dưới EMA và RSI>50
- Hệ thống trực quan hóa trạng thái thị trường thông qua sự thay đổi màu sắc của RSI. Khi RSI> 70, nó hiển thị màu xanh lá cây và khi < 30, nó hiển thị màu đỏ.
- Nền màu xanh được thiết lập trong phạm vi RSI 30-70 để giúp xác định các khu vực trung lập
Lợi thế chiến lược
- Sự kết hợp của nhiều chỉ báo kỹ thuật cải thiện độ tin cậy của tín hiệu giao dịch
- Đường WMA phản ứng tốt hơn với những thay đổi giá gần đây, trong khi đường EMA vẫn theo dõi xu hướng dài hạn.
- RSI hoạt động như một bộ lọc để tránh các tín hiệu sai trong thị trường quá biến động
- Thiết kế giao diện trực quan giúp các nhà giao dịch đánh giá trực quan tình hình thị trường
- Bao gồm một hệ thống cảnh báo hoàn chỉnh để thông báo kịp thời cho các nhà giao dịch về các cơ hội giao dịch tiềm năng
Rủi ro chiến lược
- Tín hiệu đột phá sai thường xuyên có thể xảy ra trong thị trường đi ngang
- Độ trễ của đường trung bình động có thể gây ra sự chậm trễ nhỏ trong thời điểm vào lệnh
- Cài đặt cố định cho ngưỡng RSI có thể không phù hợp trong mọi môi trường thị trường
- Việc không xem xét các yếu tố biến động có thể làm tăng rủi ro trong thời kỳ biến động cao
- Việc thiếu cơ chế dừng lỗ và dừng lợi nhuận có thể ảnh hưởng đến hiệu quả quản lý quỹ
Hướng tối ưu hóa chiến lược
- Giới thiệu ngưỡng RSI thích ứng, được điều chỉnh động theo biến động của thị trường
- Thêm chỉ báo ATR để kiểm soát quy mô vị thế và thiết lập mức dừng lỗ động
- Tối ưu hóa cài đặt chu kỳ WMA và EMA và cân nhắc điều chỉnh chúng theo các khung thời gian khác nhau
- Thêm chỉ báo khối lượng như một tín hiệu xác nhận phụ trợ
- Triển khai các hệ thống quản lý vị trí phức tạp hơn, chẳng hạn như sắp xếp theo hình kim tự tháp và giảm vị trí
Tóm tắt
Đây là chiến lược theo dõi xu hướng dựa trên nhiều chỉ báo kỹ thuật. Thông qua việc sử dụng phối hợp RSI, WMA và EMA, chiến lược này cố gắng nắm bắt các điểm đảo chiều xu hướng thị trường đồng thời đảm bảo tính ổn định của giao dịch. Mặc dù có một số rủi ro về độ trễ và tín hiệu sai, nhưng thông qua các biện pháp quản lý rủi ro và tối ưu hóa hợp lý, chiến lược này có giá trị thực tiễn tốt và có không gian mở rộng.
- 1