
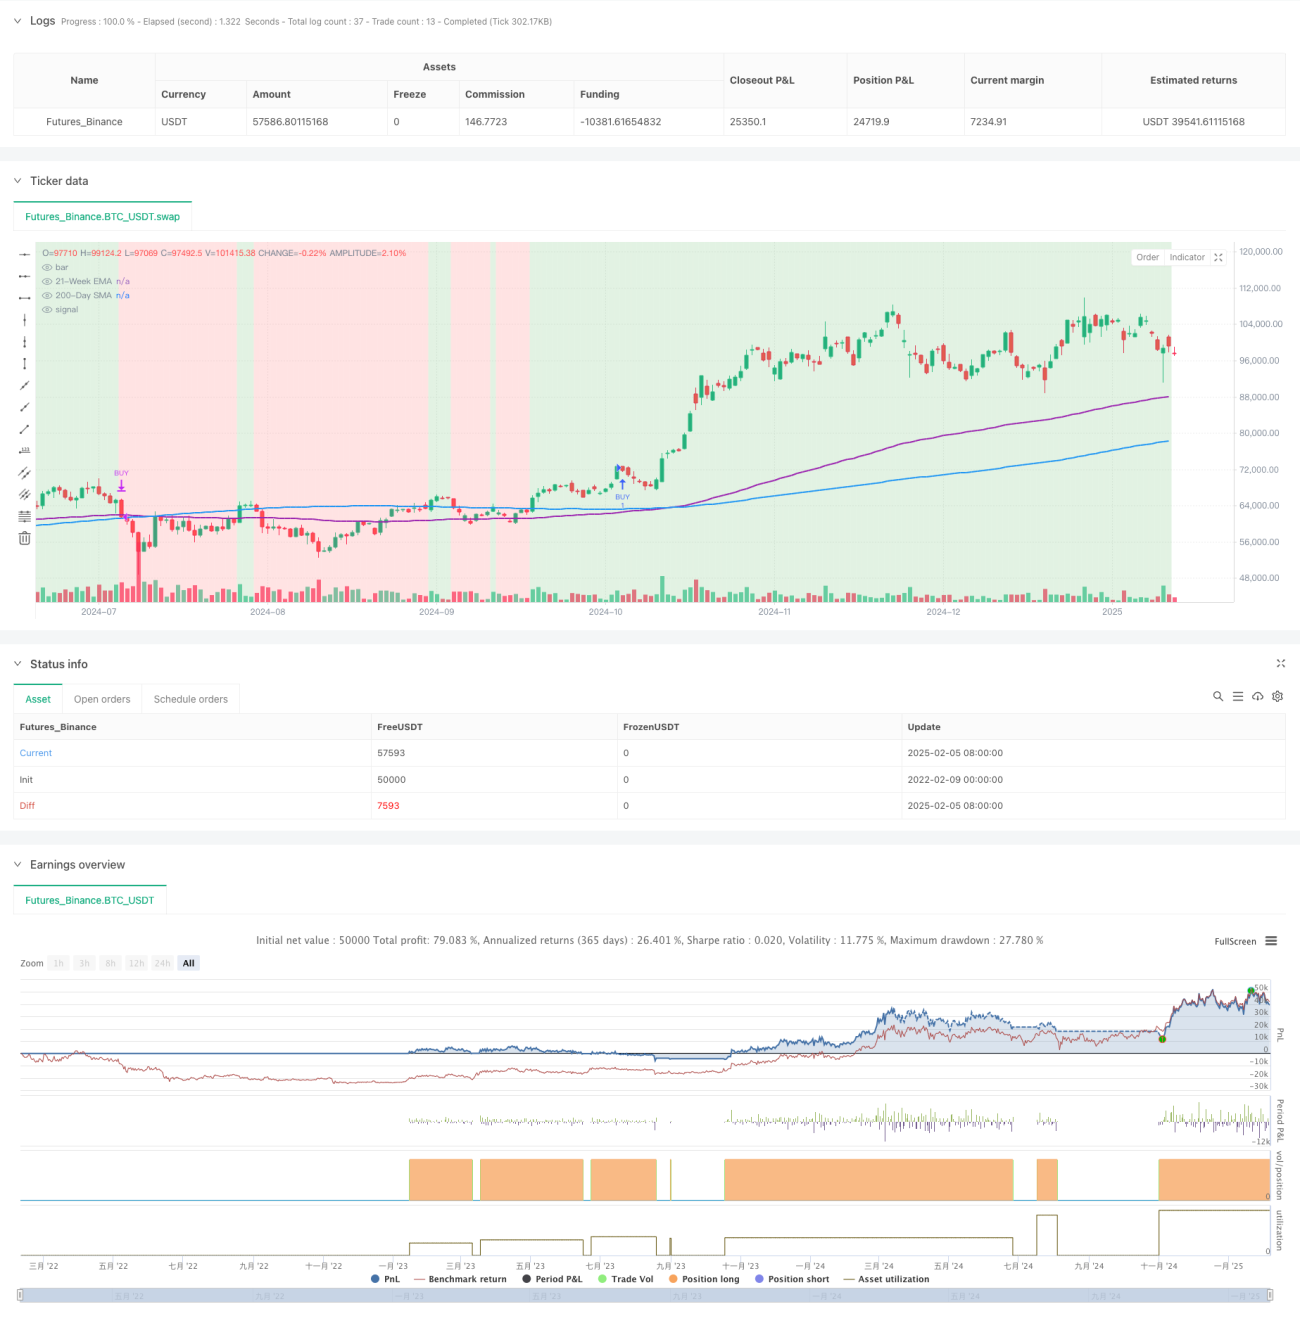
Tổng quan
Chiến lược này là một hệ thống theo dõi xu hướng động dựa trên phân tích kỹ thuật, chủ yếu sử dụng đường hai đường trung bình (đường trung bình di chuyển đơn giản 200 ngày và đường trung bình di chuyển chỉ số 21 tuần) để xác định xu hướng thị trường. Chiến lược này thực hiện quản lý rủi ro động bằng cách tích hợp các chỉ số tương đối mạnh (RSI) và chỉ số xu hướng trung bình (ADX) làm bộ lọc động lực và kết hợp với tần số sóng thực (ATR) để nắm bắt chính xác xu hướng tăng và kiểm soát rủi ro hiệu quả.
Nguyên tắc chiến lược
Logic cốt lõi của chiến lược này dựa trên các yếu tố chính sau:
- Sử dụng xác nhận kép của trung bình di chuyển đơn giản 200 ngày (SMA) và trung bình di chuyển chỉ số 21 tuần (EMA) để xác định điều kiện thị trường đa đầu
- Đảm bảo động lực tiếp tục tăng lên thông qua điều kiện RSI> 50
- Sử dụng điều kiện xác minh cường độ xu hướng khi ADX> 25
- Cài đặt dừng lỗ động dựa trên ATR, cung cấp kiểm soát rủi ro phù hợp với biến động thị trường
- Sử dụng hệ thống %-stop để đảm bảo thu lợi nhuận đúng lúc khi đạt được lợi nhuận dự kiến
Lợi thế chiến lược
- Hệ thống có khả năng thích ứng tốt, có thể điều chỉnh vị trí dừng lỗ theo động thái biến động của thị trường
- Bi-equilibrium crossover cung cấp tín hiệu xác nhận xu hướng đáng tin cậy, giảm hiệu quả nguy cơ phá vỡ giả
- Qua sự kết hợp của RSI và ADX, chất lượng tín hiệu đầu vào được cải thiện đáng kể
- Các tham số chiến lược có thể được tùy chỉnh cao để tối ưu hóa phù hợp với các môi trường thị trường khác nhau
- Sử dụng giao dịch ở cấp độ ngày, giảm chi phí giao dịch và tác động của biến động ngắn hạn
Rủi ro chiến lược
- Các tín hiệu sai thường xuyên có thể được tạo ra trong một thị trường biến động, làm tăng chi phí giao dịch
- Chiến lược đường trung bình tự nhiên có tính chậm trễ và có thể bỏ lỡ một phần lợi nhuận khi bắt đầu xu hướng
- Điều kiện lọc nhiều lần có thể làm mất đi một số cơ hội giao dịch tiềm năng
- Trong một thị trường biến động mạnh mẽ, ATR có thể được giảm nhẹ
- Lưu ý rằng tỷ lệ phần trăm cố định có thể đóng băng lợi nhuận quá sớm trong xu hướng mạnh.
Hướng tối ưu hóa chiến lược
- Có thể giới thiệu chỉ số giao thông như xác nhận phụ trợ, tăng độ tin cậy tín hiệu
- Xem xét thêm cơ chế dừng động để thích ứng tốt hơn với các giai đoạn thị trường khác nhau
- Tối ưu hóa các thiết lập tham số của RSI và ADX để cải thiện tính kịp thời của tín hiệu
- Phân loại định mức tăng cường xu hướng, quản lý động vị trí
- Nhập các chỉ số biến động thị trường, điều chỉnh tần suất giao dịch thích hợp trong thời gian biến động cao
Tóm tắt
Đây là một chiến lược theo dõi xu hướng được thiết kế hợp lý, logic rõ ràng, bằng cách sử dụng nhiều chỉ số kỹ thuật phối hợp, cân bằng lợi nhuận và rủi ro tốt hơn. Chiến lược có thể tùy biến mạnh mẽ, phù hợp để duy trì hiệu quả của nó thông qua tối ưu hóa tham số trong các môi trường thị trường khác nhau. Mặc dù có một số rủi ro trì trệ, nhưng thông qua cơ chế kiểm soát rủi ro hoàn thiện, chiến lược tổng thể thể hiện sự ổn định và đáng tin cậy tốt hơn.
/*backtest
start: 2022-02-09 00:00:00
end: 2025-02-06 08:00:00
period: 1d
basePeriod: 1d
exchanges: [{"eid":"Futures_Binance","currency":"BTC_USDT"}]
*/

//@version=6
strategy("BTCUSDT Daily - Enhanced Bitcoin Bull Market Support [CYRANO]", shorttitle="BTCUSDT Daily BULL MARKET", overlay=true, commission_type=strategy.commission.percent, commission_value=0.1, slippage=3)

// Inputs- 1