
Tổng quan
Đây là một chiến lược theo dõi xu hướng dựa trên nhiều chỉ số kỹ thuật và quản lý rủi ro. Chiến lược này sử dụng nhiều chỉ số kỹ thuật như trung bình di chuyển, chỉ số tương đối mạnh (RSI), chỉ số chuyển động (DMI) để xác định xu hướng thị trường và bảo vệ an toàn tài chính bằng các biện pháp kiểm soát rủi ro như dừng động, quản lý vị trí và giới hạn rút tối đa hàng tháng.
Nguyên tắc chiến lược
Chiến lược này sử dụng các cơ chế xác nhận xu hướng đa cấp:
- Định hướng xu hướng thông qua chỉ số chu kỳ 8/21/50 của đường trung bình di chuyển (EMA)
- Sử dụng đường trung bình của kênh giá như một bộ lọc xu hướng
- Kết hợp với đường trung bình RSI ((5 chu kỳ) trong khoảng 35-65 để lọc các đột phá giả
- Sự xác nhận cường độ của xu hướng thông qua chỉ số DMI ((14 chu kỳ)
- Sử dụng chỉ số động lực ((8 chu kỳ) và tăng cường giao dịch để xác minh tính bền vững của xu hướng
- Sử dụng dừng động dựa trên ATR để kiểm soát rủi ro
- Thực hiện quản lý vị trí theo mô hình rủi ro cố định với mức rủi ro 5% vốn đầu tư cho mỗi giao dịch
- Thiết lập giới hạn rút tiền tối đa hàng tháng 10% để tránh tổn thất quá mức
Lợi thế chiến lược
- Xác thực chéo nhiều chỉ số kỹ thuật giúp xác định xu hướng chính xác hơn
- Cơ chế dừng lỗ động có hiệu quả kiểm soát rủi ro giao dịch đơn lẻ
- Phương pháp quản lý vị thế với rủi ro cố định giúp sử dụng quỹ hợp lý hơn
- Giới hạn rút tiền tối đa hàng tháng cung cấp bảo vệ rủi ro hệ thống
- Kết hợp các chỉ số giao dịch để tăng độ tin cậy xác định xu hướng
- Thiết lập tỷ lệ lợi nhuận 2:1 giúp tăng lợi nhuận trong dài hạn
Rủi ro chiến lược
- Việc sử dụng nhiều chỉ số có thể gây ra sự chậm trễ tín hiệu
- Có thể tạo ra các tín hiệu sai lệch thường xuyên trong thị trường bất ổn
- Mô hình rủi ro cố định có thể không đủ linh hoạt khi biến động mạnh
- Hạn chế rút tiền hàng tháng có thể khiến bạn bỏ lỡ cơ hội giao dịch quan trọng
- Xu hướng có thể bị giảm mạnh khi đảo ngược
Hướng tối ưu hóa chiến lược
- Tiến hành các tham số chỉ số thích ứng để thích ứng với các môi trường thị trường khác nhau
- Phát triển các chương trình quản lý vị trí linh hoạt hơn, tính đến sự thay đổi của thị trường
- Đánh giá định lượng tăng cường xu hướng, tối ưu hóa thời gian nhập cảnh
- Thiết kế cơ chế hạn chế rủi ro hàng tháng thông minh hơn
- Thêm mô-đun nhận diện môi trường thị trường để điều chỉnh các tham số chiến lược trong các điều kiện thị trường khác nhau
Tóm tắt
Chiến lược này tạo ra một hệ thống giao dịch theo dõi xu hướng tương đối hoàn chỉnh thông qua việc sử dụng tổng hợp các chỉ số kỹ thuật đa chiều. Ưu điểm của chiến lược là khung quản lý rủi ro toàn diện của nó, bao gồm dừng động, quản lý vị trí và kiểm soát rút lui. Mặc dù có một số rủi ro bị tụt hậu, nhưng bằng cách tối ưu hóa và cải tiến, chiến lược có thể duy trì hiệu suất ổn định trong các môi trường thị trường khác nhau.
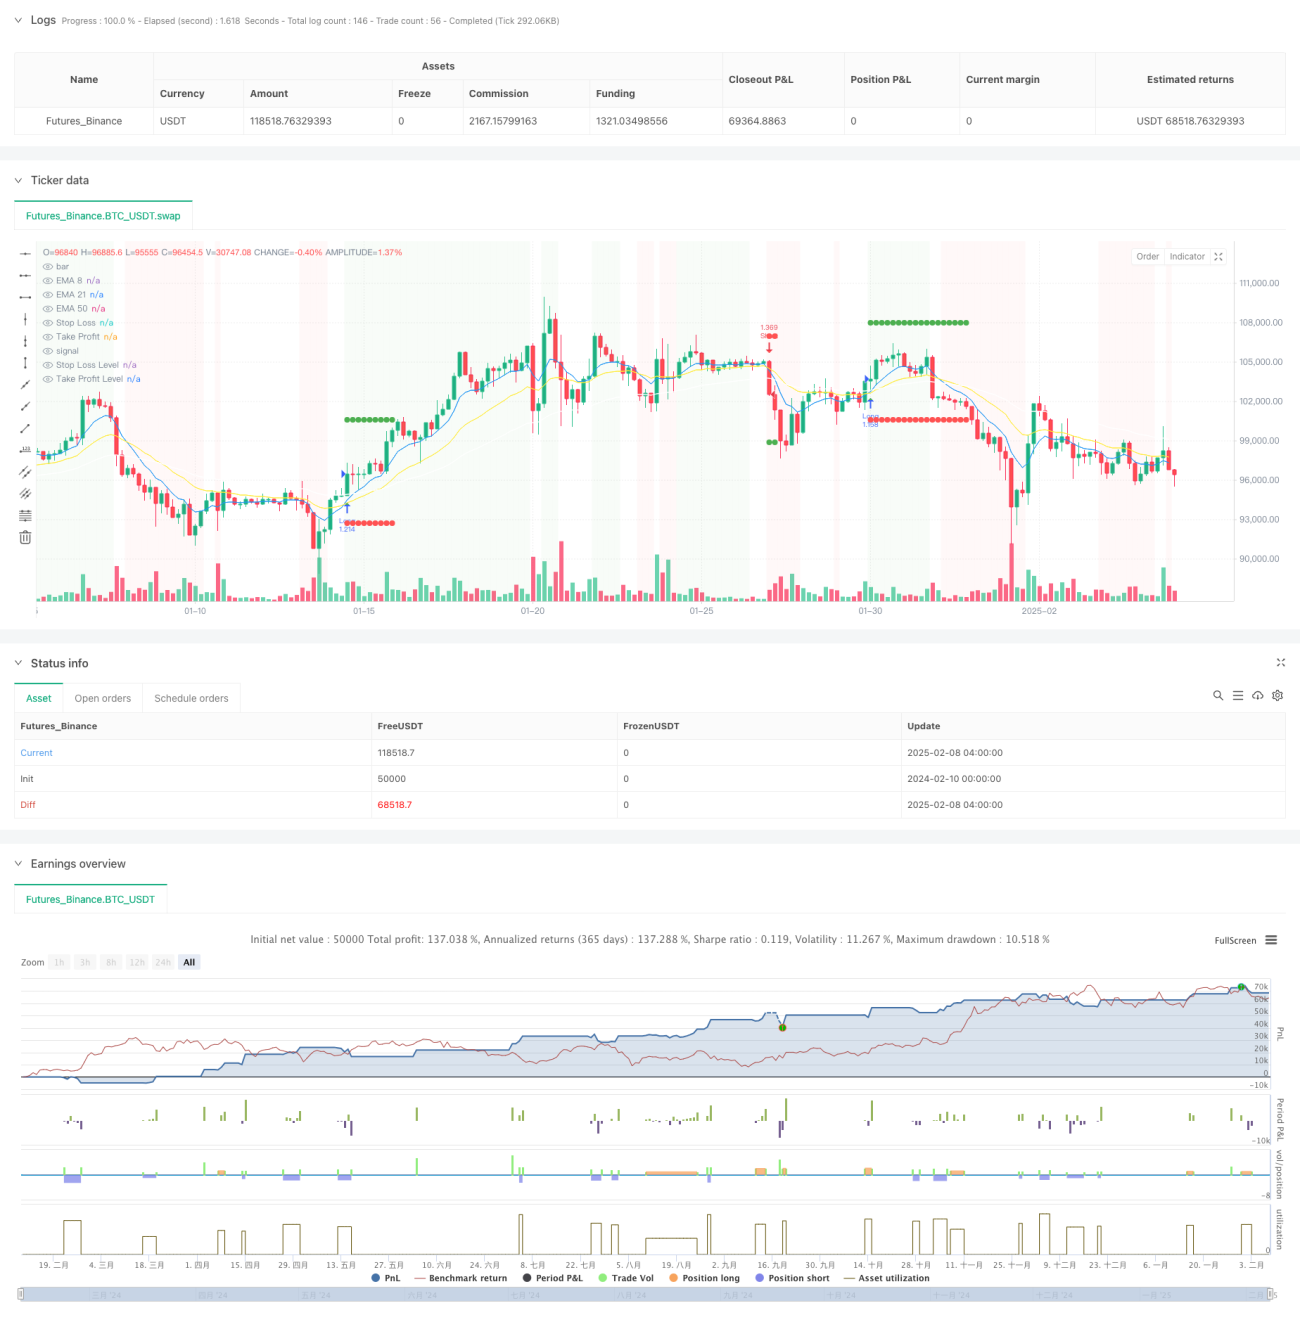
/*backtest
start: 2024-02-10 00:00:00
end: 2025-02-08 08:00:00
period: 4h
basePeriod: 4h
exchanges: [{"eid":"Futures_Binance","currency":"BTC_USDT"}]
*/

//@version=5
strategy("High Win-Rate Crypto Strategy with Drawdown Limit", overlay=true, initial_capital=10000, default_qty_type=strategy.fixed, process_orders_on_close=true)

// Moving Averages- 1