1
tập trung vào
1750
Người theo dõi
Tổng quan
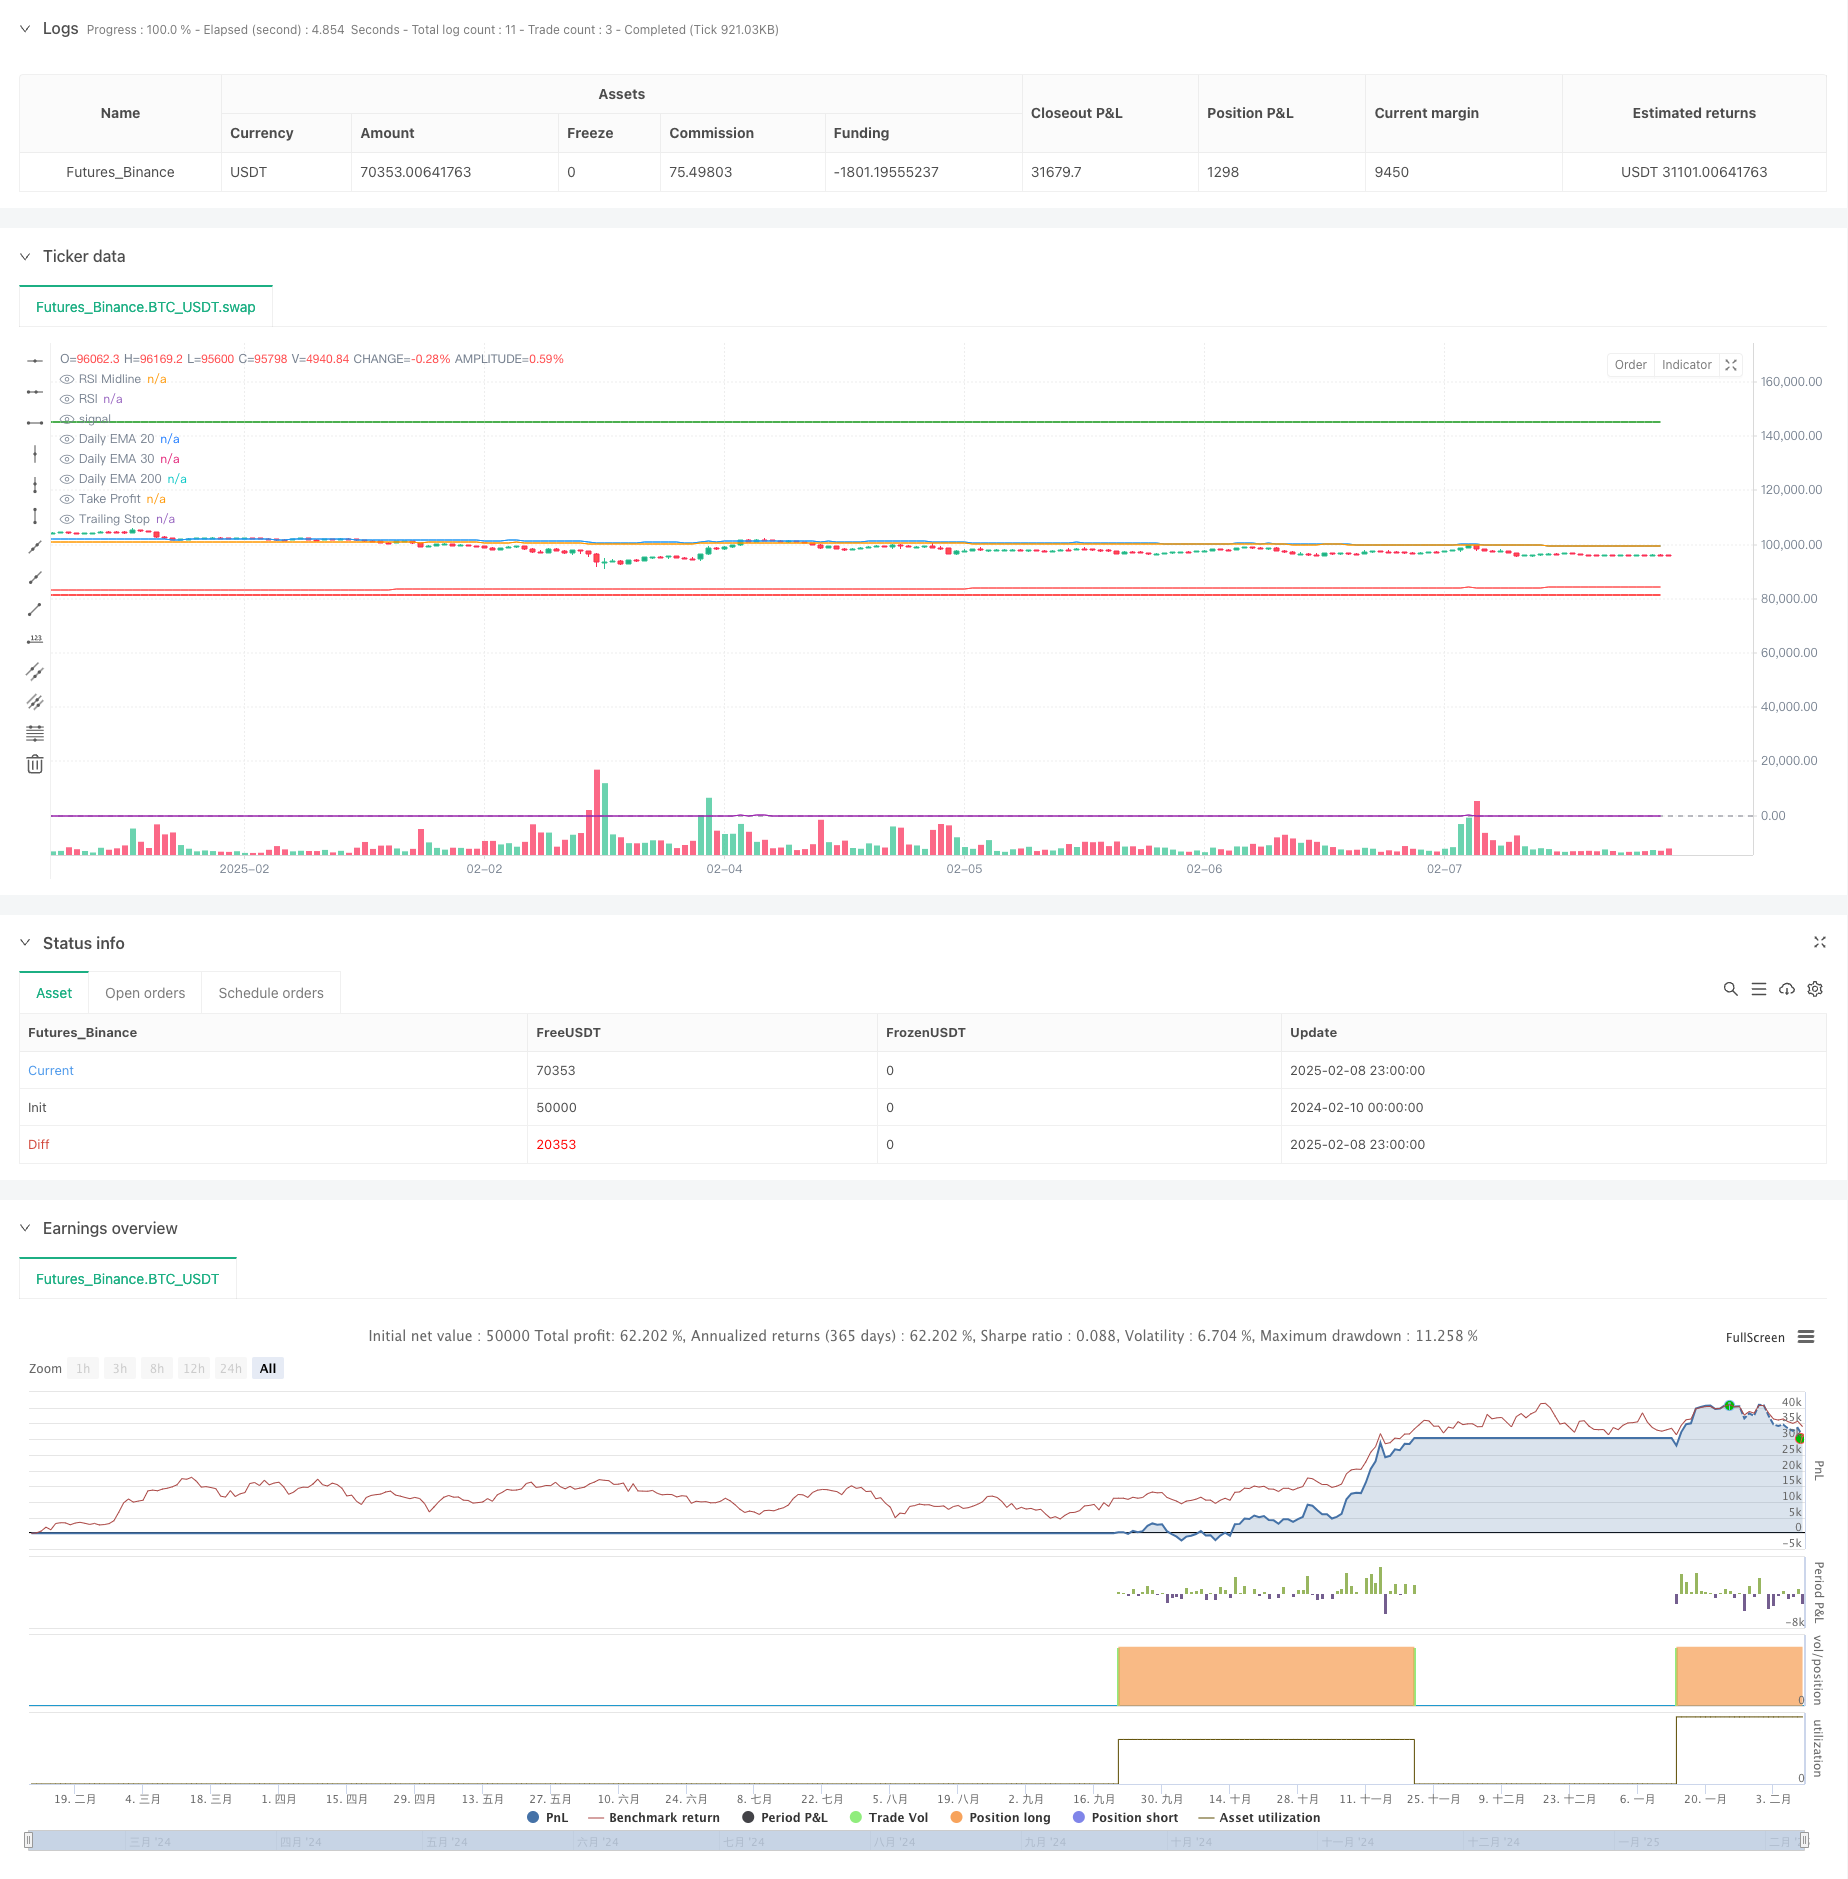
Chiến lược này là một hệ thống giao dịch theo dõi xu hướng dựa trên moving average (EMA) và chỉ số tương đối mạnh (RSI) của nhiều chỉ số. Chiến lược này kết hợp các tín hiệu chéo EMA (20, 30, 200) ở mức đường mặt trời, xác nhận động lực RSI và cơ chế dừng động nhằm nắm bắt cơ hội xu hướng dài hạn trong thị trường.
Nguyên tắc chiến lược
Logic cốt lõi của chiến lược bao gồm các thành phần chính sau:
- Tín hiệu nhập: hệ thống tạo ra tín hiệu đa khi đường 20 ngày EMA đi lên vượt qua 30 ngày EMA, và giá nằm trên 200 ngày EMA, và RSI lớn hơn 50.
- Cài đặt dừng: Cài đặt dừng cố định 50% sau khi vào.
- Hạn chế động: sử dụng 25% động theo dõi dừng, di chuyển vị trí dừng lên khi giá sáng tạo cao.
- Cơ chế thoát ra: Khi giá chạm điểm dừng hoặc theo dõi điểm dừng lỗ, vị trí thanh toán tự động sẽ kết thúc giao dịch.
Lợi thế chiến lược
- Xác minh nhiều chu kỳ: lọc biến động ngắn hạn thông qua kết hợp đường trung bình ở cấp độ đường hồng ngoại để tăng sự ổn định giao dịch.
- Quản lý rủi ro năng động: Theo dõi các cơ chế dừng lỗ có thể khóa lợi nhuận một cách hiệu quả và tránh rút lui mạnh mẽ.
- Xác định xu hướng đầy đủ: Chỉ số RSI kết hợp với hệ thống đường trung bình để xác nhận hiệu quả của xu hướng.
- Logic thực hiện rõ ràng: Điều kiện nhập cảnh và xuất cảnh rõ ràng, dễ hiểu và vận hành.
Rủi ro chiến lược
- Rủi ro thị trường chấn động: có thể thường xuyên kích hoạt dừng lỗ trong thị trường chấn động ngang.
- Tác động của điểm trượt: Trong thị trường biến động mạnh, các điểm dừng động và điểm dừng có thể có điểm trượt lớn hơn.
- Nguy cơ phá vỡ giả: tín hiệu giao nhau theo đường trung bình có thể bị phá vỡ giả.
- Tính nhạy cảm của tham số: thiết lập tỷ lệ dừng và dừng có ảnh hưởng lớn đến hiệu suất của chiến lược.
Hướng tối ưu hóa chiến lược
- Bộ lọc môi trường thị trường: Có thể thêm các chỉ số biến động (như ATR) để đánh giá môi trường thị trường, giảm vị trí hoặc tạm dừng giao dịch trong thị trường biến động.
- Động lực hóa dừng: xem xét việc điều chỉnh tỷ lệ dừng theo biến động của thị trường.
- Tối ưu hóa tín hiệu nhập cảnh: có thể giới thiệu chỉ số khối lượng giao thông để kết hợp với tín hiệu chéo đồng tuyến, tăng độ tin cậy tín hiệu.
- Quản lý vị trí được cải thiện: giới thiệu cơ chế quản lý vị trí động, tự động điều chỉnh quy mô mở vị trí theo mức độ rủi ro của thị trường.
Tóm tắt
Chiến lược này xây dựng một hệ thống giao dịch theo dõi xu hướng hoàn chỉnh thông qua sự phối hợp phối hợp của nhiều chỉ số kỹ thuật. Đặc điểm chính của chiến lược là kết hợp phán đoán xu hướng trung và dài hạn với kiểm soát rủi ro động, phù hợp để hoạt động trong môi trường thị trường có xu hướng rõ ràng.
Mã nguồn chiến lược
/*backtest
start: 2024-02-10 00:00:00
end: 2025-02-09 00:00:00
period: 1h
basePeriod: 1h
exchanges: [{"eid":"Futures_Binance","currency":"BTC_USDT"}]
*/

//@version=5
strategy("Talbuaia Signal", overlay=true)

// Request EMAs on the daily timeframe
ema20_daily = request.security(syminfo.tickerid, "D", ta.ema(close, 20), lookahead=barmerge.lookahead_on)
ema30_daily = request.security(syminfo.tickerid, "D", ta.ema(close, 30), lookahead=barmerge.lookahead_on)
ema200_daily = request.security(syminfo.tickerid, "D", ta.ema(close, 200), lookahead=barmerge.lookahead_on)

// RSI Calculation
rsi = ta.rsi(close, 14)

// Plot daily EMAs
plot(ema20_daily, color=color.blue, title="Daily EMA 20")
plot(ema30_daily, color=color.orange, title="Daily EMA 30")
plot(ema200_daily, color=color.red, title="Daily EMA 200")

// Plot RSI
hline(50, "RSI Midline", color=color.gray)
plot(rsi, color=color.purple, title="RSI")

// Entry condition: 20 EMA crosses above 30 EMA, price is above 200 EMA, and RSI > 50
bullishEntry = ta.crossover(ema20_daily, ema30_daily) and close > ema200_daily and rsi > 50

// Variables to track entry price, take profit, and trailing stop
var float entryPriceLong = na
var float highestPriceSinceEntry = na
var float takeProfitLevel = na
var float trailingStopLevel = na

// Entry Logic
if bullishEntry
    strategy.entry("Long", strategy.long)
    entryPriceLong := close
    highestPriceSinceEntry := close  // Initialize the highest price since entry
    takeProfitLevel := entryPriceLong * 1.50  // Set take profit at 50% above entry price
    trailingStopLevel := na  // Reset trailing stop
    label.new(bar_index, close, "BUY", style=label.style_label_up, color=color.green, textcolor=color.white)

// Update highest price and trailing stop dynamically
if strategy.position_size > 0
    highestPriceSinceEntry := math.max(highestPriceSinceEntry, close)  // Track the highest price reached
    trailingStopLevel := highestPriceSinceEntry * (1 - 0.25)  // Set trailing stop at 25% below the highest price

// Exit Logic: Take profit or trailing stop
if strategy.position_size > 0 and (close >= takeProfitLevel or close <= trailingStopLevel)
    strategy.close("Long")
    label.new(bar_index, close, "EXIT LONG", style=label.style_label_down, color=color.red, textcolor=color.white)

// Plot trailing stop and take profit levels on the chart
plot(trailingStopLevel, "Trailing Stop", color=color.red, linewidth=2, style=plot.style_line)
plot(takeProfitLevel, "Take Profit", color=color.green, linewidth=2, style=plot.style_line)