Chiến lược phân tích sự mệt mỏi của thị trường nhiều giai đoạn và hệ thống quản lý rủi ro

ATR RRR SL TP DD
Ngày tạo: 2025-02-10 14:27:15 sửa đổi lần cuối: 2025-02-10 14:27:15
sao chép: 1 Số nhấp chuột: 370
1
tập trung vào
1617
Người theo dõi

Chiến lược phân tích sự mệt mỏi của thị trường nhiều giai đoạn và hệ thống quản lý rủi ro

Tổng quan

Chiến lược này là một hệ thống giao dịch đa tầng dựa trên phân tích mệt mỏi thị trường, xác định các thời điểm quan trọng khi thị trường có thể biến đổi thông qua phân tích sâu về động thái giá. Chiến lược này kết hợp các cơ chế quản lý rủi ro động, bao gồm nhiều chiều như quản lý tiền, tối ưu hóa dừng lỗ và kiểm soát rút tiền, để tạo thành một khung quyết định giao dịch hoàn chỉnh.

Nguyên tắc chiến lược

Trọng tâm của chiến lược này là đánh giá mức độ mệt mỏi của thị trường bằng cách theo dõi sự chuyển động liên tục của giá cả.

  1. Xác định hướng xu hướng bằng cách so sánh giá đóng cửa hiện tại với giá đóng cửa của đường K 4 trước đó
  2. Cài đặt các điểm kích hoạt tín hiệu với ba mức độ cường độ khác nhau (9/12/14)
  3. Hệ thống sẽ tích lũy tín hiệu khi giá tiếp tục di chuyển theo một hướng
  4. Một khi đạt đến ngưỡng cường độ tín hiệu mặc định, hệ thống sẽ đưa ra tín hiệu giao dịch tương ứng
  5. Một hệ thống quản lý vị trí tích hợp cơ chế dừng lỗ động dựa trên ATR và tỷ lệ lợi nhuận rủi ro

Lợi thế chiến lược

  1. Hệ thống tín hiệu đa tầng cung cấp các mức độ nhận diện cơ hội giao dịch khác nhau
  2. Bảo vệ an toàn tài chính thông qua quản lý tài chính và kiểm soát rủi ro
  3. Sử dụng ATR dừng động để thích ứng tốt hơn với biến động của thị trường
  4. Tiếp theo, một hệ thống tracking Stop Loss được giới thiệu, giúp bạn có thể khóa lợi nhuận tốt hơn.
  5. Thiết lập bảo vệ rút lui tối đa để tránh thiệt hại quá mức
  6. Hệ thống có khả năng mở rộng tốt và tối ưu hóa tham số

Rủi ro chiến lược

  1. Có thể tạo ra tín hiệu sai trong thị trường chấn động
  2. Mức giới hạn tín hiệu cố định có thể không phù hợp với tất cả các môi trường thị trường
  3. Lưu ý: Lưu ý: Lưu ý:
  4. Cần tối ưu hóa tham số nhiều hơn
  5. Hệ thống quản lý tiền có thể hạn chế lợi nhuận trong một số trường hợp

Hướng tối ưu hóa chiến lược

  1. Tiến hành cơ chế lọc tỷ lệ dao động của thị trường để điều chỉnh ngưỡng tín hiệu trong môi trường dao động khác nhau
  2. Tăng kích thước phân tích khối lượng và cải thiện độ tin cậy của tín hiệu
  3. Phát triển hệ thống tối ưu hóa tham số thích ứng
  4. Thêm nhiều chỉ số phân tích môi trường thị trường
  5. Tối ưu hóa hệ thống quản lý tài chính, làm cho nó linh hoạt hơn

Tóm tắt

Chiến lược này cung cấp cho các nhà giao dịch một khung giao dịch có hệ thống thông qua phân tích mệt mỏi nhiều cấp và hệ thống quản lý rủi ro tốt. Mặc dù có một số nơi cần được tối ưu hóa, nhưng khái niệm thiết kế tổng thể vẫn còn nguyên vẹn và có giá trị ứng dụng thực tế.
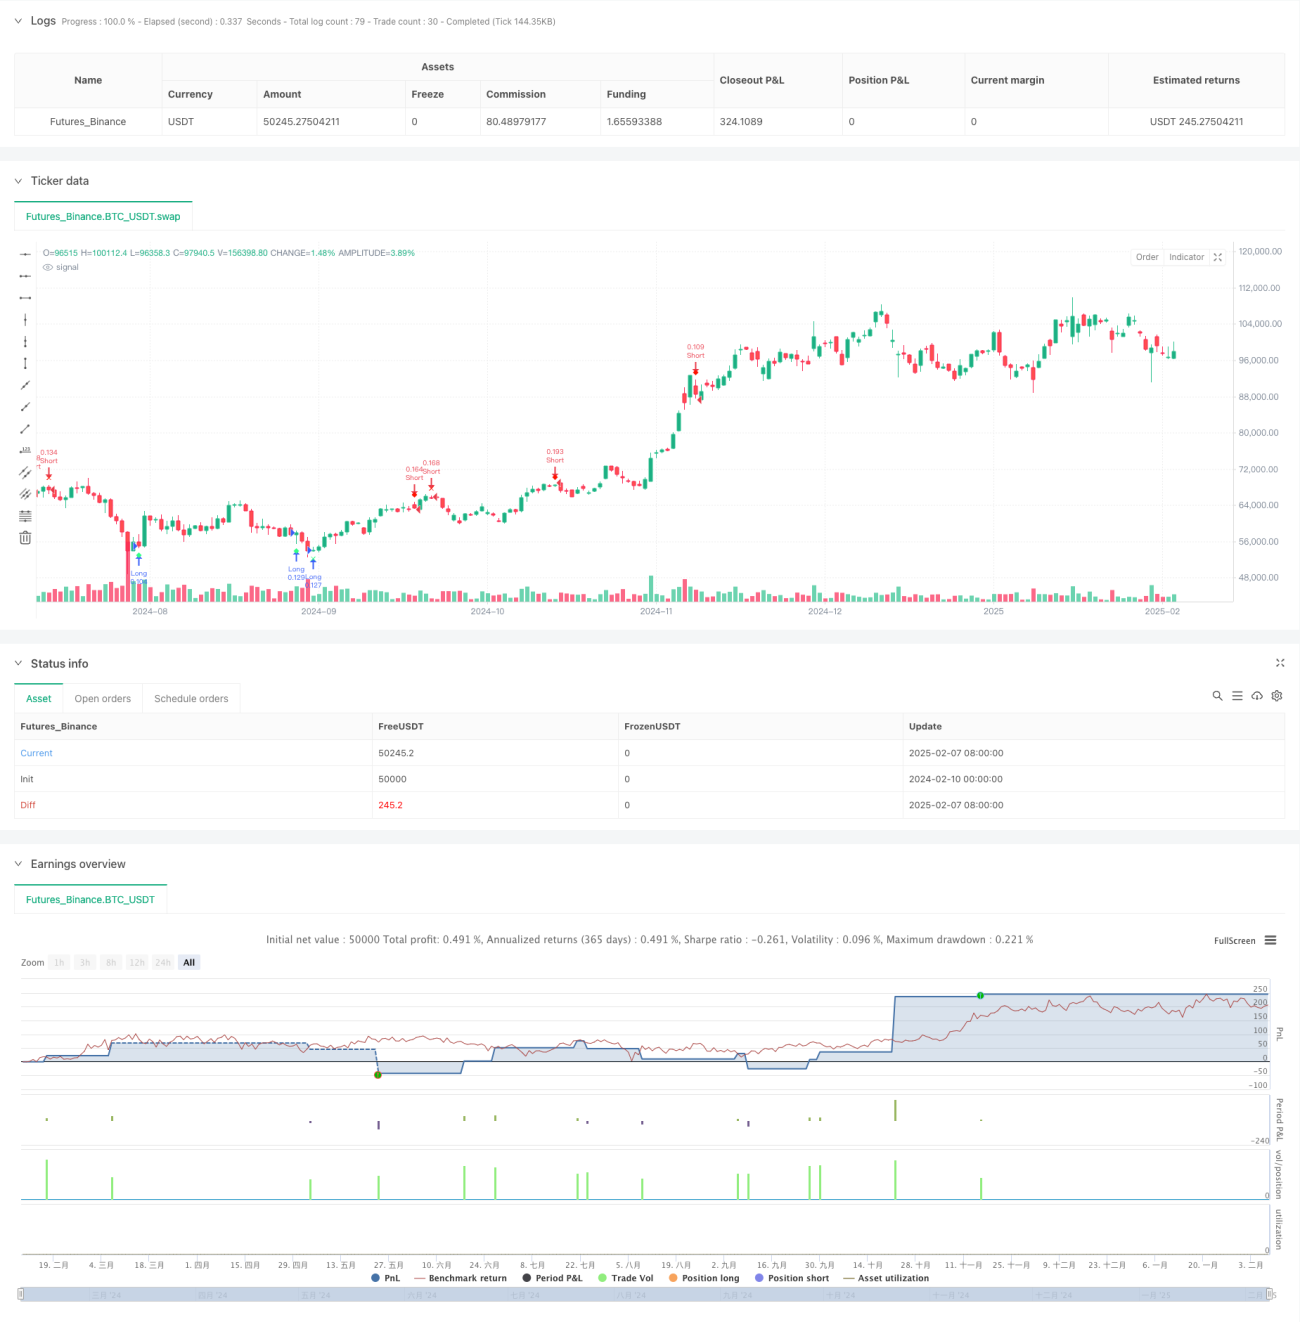
Mã nguồn chiến lược
/*backtest
start: 2024-02-10 00:00:00
end: 2025-02-08 08:00:00
period: 1d
basePeriod: 1d
exchanges: [{"eid":"Futures_Binance","currency":"BTC_USDT"}]
*/

//@version=6
strategy(title="Improved Exhaustion Signal with Risk Management and Drawdown Control", shorttitle="Exhaustion Signal", overlay=true)

// ———————————————— INPUT SETTINGS ————————————————
showLevel1 = input.bool(true, 'Show Level 1 Signals')
showLevel2 = input.bool(true, 'Show Level 2 Signals')
showLevel3 = input.bool(true, 'Show Level 3 Signals')

// Thresholds for signal strength levels
level1 = 9
level2 = 12
level3 = 14

// Risk management inputs
riskPercentage = input.float(1.0, title="Risk Percentage per Trade", minval=0.1, maxval=5.0)  // Risk per trade in percentage
riskRewardRatio = input.float(2.0, title="Risk-to-Reward Ratio", minval=1.0, maxval=5.0)  // Reward-to-risk ratio
trailingStop = input.bool(true, title="Enable Trailing Stop")  // Enable/Disable trailing stop
trailingStopDistance = input.int(50, title="Trailing Stop Distance (in points)", minval=1)  // Distance for trailing stop

// Drawdown protection settings
maxDrawdown = input.float(10.0, title="Max Drawdown Percentage", minval=0.1, maxval=50.0)  // Max allowable drawdown before stopping trading

// ———————————————— GLOBAL VARIABLES ————————————————
var int cycle = 0
var int bullishSignals = 0
var int bearishSignals = 0
var float equityHigh = na  // Initialize as undefined

// Track equity drawdown
if (na(equityHigh) or strategy.equity > equityHigh)
    equityHigh := strategy.equity

drawdownPercent = 100 * (equityHigh - strategy.equity) / equityHigh

// Stop trading if drawdown exceeds the limit
if drawdownPercent >= maxDrawdown
    strategy.close_all()

// ———————————————— FUNCTION: RESET & IMMEDIATE RECHECK USING AN ARRAY RETURN ————————————————
f_resetAndRecheck(_bullish, _bearish, _cycle, _close, _close4) =>
    newBullish = _bullish
    newBearish = _bearish
    newCycle = _cycle

    // Reset cycle if necessary based on price action
    newBullish := 0
    newBearish := 0
    newCycle := 0

    if _close < _close4
        newBullish := 1
        newCycle := newBullish
    else if _close > _close4
        newBearish := 1
        newCycle := newBearish

    resultArray = array.new_int(3, 0)
    array.set(resultArray, 0, newBullish)
    array.set(resultArray, 1, newBearish)
    array.set(resultArray, 2, newCycle)

    resultArray

// ———————————————— EXHAUSTION LOGIC ————————————————
if cycle < 9
    // Bullish cycle: close < close[4]
    if close < close[4]
        bullishSignals += 1
        bearishSignals := 0
        cycle := bullishSignals
    // Bearish cycle: close > close[4]
    else if close > close[4]
        bearishSignals += 1
        bullishSignals := 0
        cycle := bearishSignals
    else
        newVals = f_resetAndRecheck(bullishSignals, bearishSignals, cycle, close, close[4])
        bullishSignals := array.get(newVals, 0)
        bearishSignals := array.get(newVals, 1)
        cycle := array.get(newVals, 2)
else
    // ——— BULLISH checks ———
    if bullishSignals > 0
        if bullishSignals < (level3 - 1)
            if close < close[3]
                bullishSignals += 1
                bearishSignals := 0
                cycle := bullishSignals
            else
                newVals = f_resetAndRecheck(bullishSignals, bearishSignals, cycle, close, close[4])
                bullishSignals := array.get(newVals, 0)
                bearishSignals := array.get(newVals, 1)
                cycle := array.get(newVals, 2)
        else if bullishSignals == (level3 - 1)
            if close < close[2]
                bullishSignals := level3
                cycle := bullishSignals
            else
                newVals = f_resetAndRecheck(bullishSignals, bearishSignals, cycle, close, close[4])
                bullishSignals := array.get(newVals, 0)
                bearishSignals := array.get(newVals, 1)
                cycle := array.get(newVals, 2)
        else
            newVals = f_resetAndRecheck(bullishSignals, bearishSignals, cycle, close, close[4])
            bullishSignals := array.get(newVals, 0)
            bearishSignals := array.get(newVals, 1)
            cycle := array.get(newVals, 2)
    // ——— BEARISH checks ———
    else if bearishSignals > 0
        if bearishSignals < (level3 - 1)
            if close > close[3]
                bearishSignals += 1
                bullishSignals := 0
                cycle := bearishSignals
            else
                newVals = f_resetAndRecheck(bullishSignals, bearishSignals, cycle, close, close[4])
                bullishSignals := array.get(newVals, 0)
                bearishSignals := array.get(newVals, 1)
                cycle := array.get(newVals, 2)
        else if bearishSignals == (level3 - 1)
            if close > close[2]
                bearishSignals := level3
                cycle := bearishSignals
            else
                newVals = f_resetAndRecheck(bullishSignals, bearishSignals, cycle, close, close[4])
                bullishSignals := array.get(newVals, 0)
                bearishSignals := array.get(newVals, 1)
                cycle := array.get(newVals, 2)
        else
            newVals = f_resetAndRecheck(bullishSignals, bearishSignals, cycle, close, close[4])
            bullishSignals := array.get(newVals, 0)
            bearishSignals := array.get(newVals, 1)
            cycle := array.get(newVals, 2)
    else
        newVals = f_resetAndRecheck(bullishSignals, bearishSignals, cycle, close, close[4])
        bullishSignals := array.get(newVals, 0)
        bearishSignals := array.get(newVals, 1)
        cycle := array.get(newVals, 2)

// ———————————————— SIGNAL FLAGS ————————————————
bullishLevel1 = showLevel1 and (bullishSignals == level1)
bearishLevel1 = showLevel1 and (bearishSignals == level1)

bullishLevel2 = showLevel2 and (bullishSignals == level2)
bearishLevel2 = showLevel2 and (bearishSignals == level2)

bullishLevel3 = showLevel3 and (bullishSignals == level3)
bearishLevel3 = showLevel3 and (bearishSignals == level3)

// ———————————————— PLOT SIGNALS ————————————————
plotshape(bullishLevel1, style=shape.diamond, color=color.new(#30ff85, 0), textcolor=color.white, size=size.tiny, location=location.belowbar, title="Level 1 Bullish Signal")
plotshape(bearishLevel1, style=shape.diamond, color=color.new(#ff1200, 0), textcolor=color.white, size=size.tiny, location=location.abovebar, title="Level 1 Bearish Signal")

plotshape(bullishLevel2, style=shape.xcross, color=color.new(#30ff85, 0), textcolor=color.white, size=size.tiny, location=location.belowbar, title="Level 2 Bullish Signal")
plotshape(bearishLevel2, style=shape.xcross, color=color.new(#ff1200, 0), textcolor=color.white, size=size.tiny, location=location.abovebar, title="Level 2 Bearish Signal")

plotshape(bullishLevel3, style=shape.flag, color=color.new(#30ff85, 0), textcolor=color.white, size=size.tiny, location=location.belowbar, title="Level 3 Bullish Signal")
plotshape(bearishLevel3, style=shape.flag, color=color.new(#ff1200, 0), textcolor=color.white, size=size.tiny, location=location.abovebar, title="Level 3 Bearish Signal")

// ———————————————— RESET AFTER LEVEL 3 ————————————————
if bullishSignals == level3 or bearishSignals == level3
    bullishSignals := 0
    bearishSignals := 0
    cycle := 0

// ———————————————— BACKTEST LOGIC ————————————————
// Set up basic long and short entry conditions based on signal levels
longCondition = bullishLevel1 or bullishLevel2 or bullishLevel3
shortCondition = bearishLevel1 or bearishLevel2 or bearishLevel3

// Calculate position size based on risk percentage
equity = strategy.equity
riskAmount = equity * riskPercentage / 100
atr = ta.atr(14)
stopLossLevel = atr * 1.5  // Using ATR for dynamic stop-loss
positionSize = riskAmount / stopLossLevel

// Initialize strategy logic
if longCondition
    strategy.entry("Long", strategy.long, qty=positionSize)

if shortCondition
    strategy.entry("Short", strategy.short, qty=positionSize)

// ———————————————— CONCRETE STOP LOSS AND TAKE PROFIT ————————————————
stopLoss = stopLossLevel
takeProfit = stopLoss * riskRewardRatio

// Apply stop loss and take profit to the strategy based on concrete price levels
strategy.exit("Exit Long", from_entry="Long", stop=close - stopLoss, limit=close + takeProfit)
strategy.exit("Exit Short", from_entry="Short", stop=close + stopLoss, limit=close - takeProfit)

// ———————————————— TRAILING STOP ————————————————
if trailingStop
    strategy.exit("Exit Long Trailing", from_entry="Long", trail_price=close - trailingStopDistance, trail_offset=trailingStopDistance)
    strategy.exit("Exit Short Trailing", from_entry="Short", trail_price=close + trailingStopDistance, trail_offset=trailingStopDistance)