Chiến lược giao dịch xu hướng trung bình động hàm mũ RSI động

Tổng quan
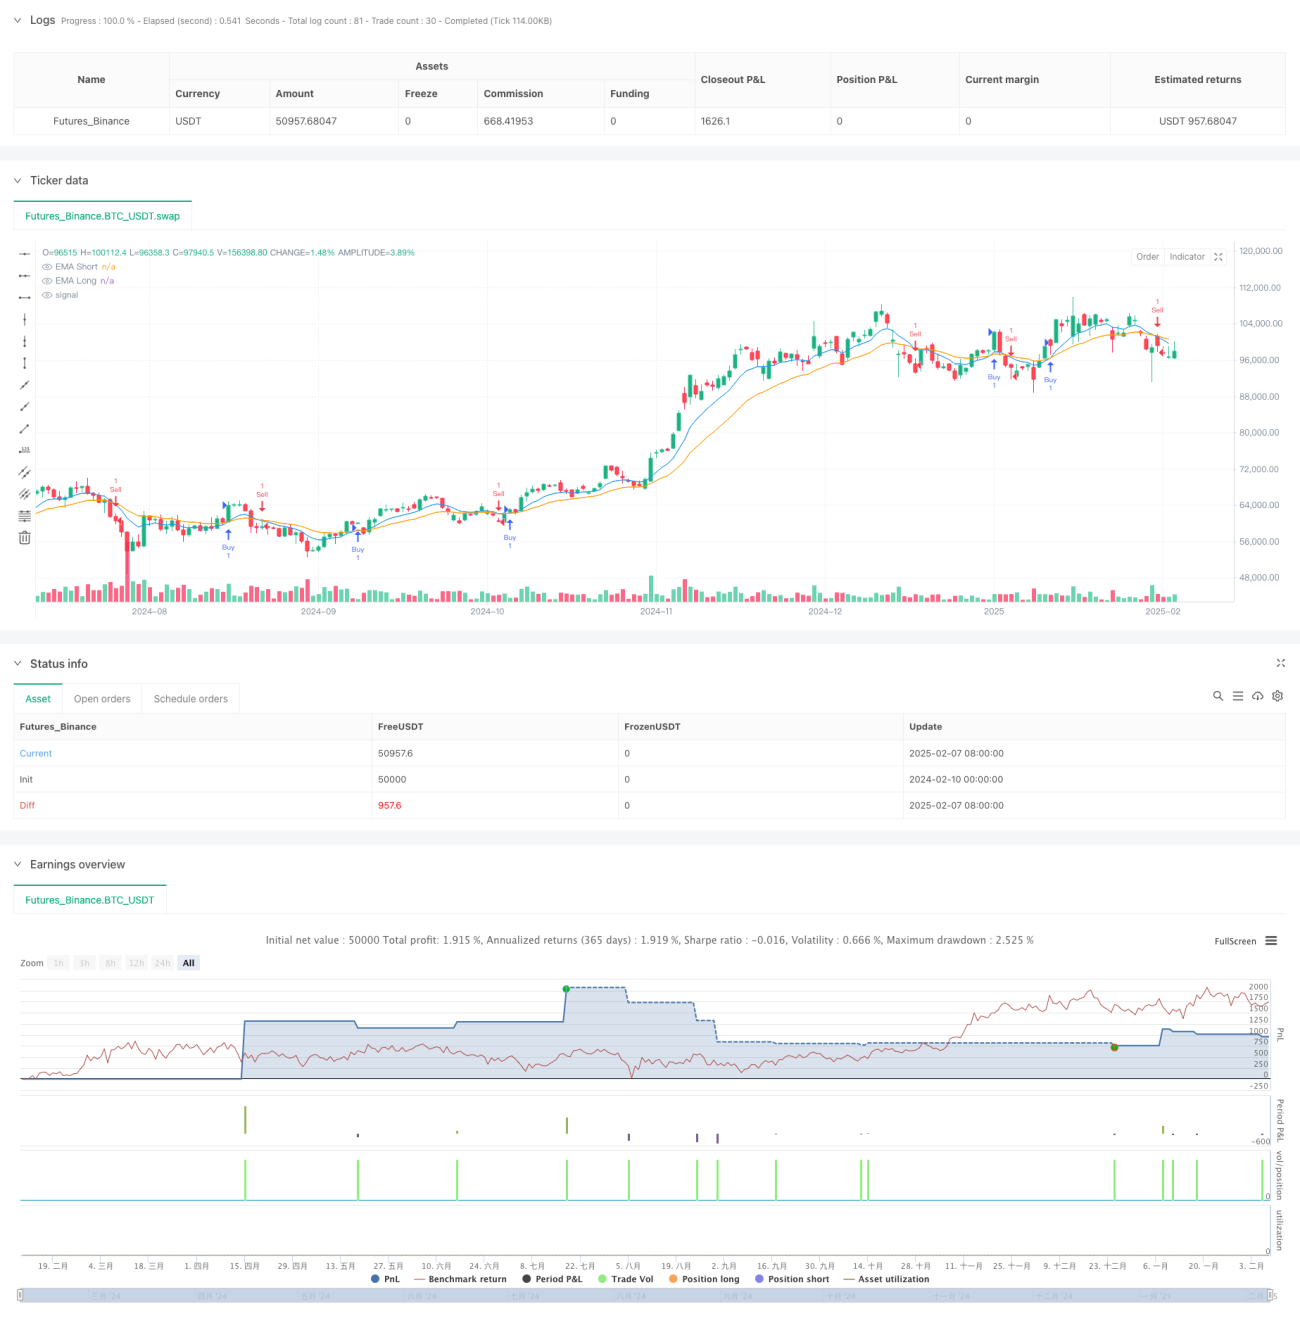
Chiến lược này là một hệ thống theo dõi xu hướng động kết hợp các chỉ số di chuyển trung bình ((EMA) và các chỉ số tương đối mạnh ((RSI)). Nó xác định hướng xu hướng thông qua sự giao thoa của 9 chu kỳ và 21 chu kỳ EMA, và sử dụng RSI như một chỉ số xác nhận xu hướng. Chiến lược này cũng bao gồm một hệ thống quản lý tiền hoàn chỉnh, bao gồm thiết lập các mục tiêu dừng động và lợi nhuận.
Nguyên tắc chiến lược
Logic cốt lõi của chiến lược này dựa trên các yếu tố chính sau:
- Sử dụng giao thoa ngắn hạn (thời kỳ 9) và dài hạn (thời kỳ 21) EMA để nắm bắt sự thay đổi xu hướng
- Xác nhận xu hướng thông qua chỉ số RSI 14 chu kỳ, yêu cầu làm nhiều hơn khi RSI> 50 và làm trần khi RSI < 50
- Thiết lập dừng lỗ với số điểm cố định (bất định là 30 điểm) và tính toán quy mô nắm giữ dựa trên số tiền rủi ro động
- Sử dụng các tham số quản lý tài chính để tính toán động giá mục tiêu lợi nhuận
- Hiển thị các điểm vào, giá mục tiêu và vị trí dừng lỗ trên biểu đồ trong thời gian thực
Lợi thế chiến lược
- Kết hợp xu hướng và động lực, tăng độ tin cậy của tín hiệu giao dịch
- Hệ thống quản lý tiền hoàn chỉnh, có thể điều chỉnh rủi ro linh hoạt theo quy mô tài khoản
- Hệ thống phản hồi trực quan rõ ràng, bao gồm các dấu hiệu thất bại giao dịch
- Các tham số có thể được tùy chỉnh hoàn toàn để phù hợp với phong cách giao dịch khác nhau
- Tự động hóa nhập cảnh và xuất cảnh, giảm sự can thiệp của con người
Rủi ro chiến lược
- EMA là một chỉ số chậm trễ có thể tạo ra tín hiệu chậm trễ trong thị trường biến động mạnh
- Tín hiệu đột phá sai thường xuyên có thể xảy ra trong thị trường đi ngang
- Lưu ý rằng các điểm dừng cố định có thể không đủ linh hoạt khi biến động
- Cần điều chỉnh cẩn thận các tham số để phù hợp với các điều kiện thị trường khác nhau
- Có thể có nguy cơ trượt trong môi trường thiếu thanh khoản
Hướng tối ưu hóa chiến lược
- Tiến hành các cơ chế dừng tự điều chỉnh như dừng động dựa trên ATR
- Thêm bộ lọc biến động thị trường, điều chỉnh các tham số chiến lược trong thời gian biến động cao
- Thêm bộ lọc thời gian giao dịch để tránh giao dịch trong thời gian bất lợi
- Phát triển hệ thống quản lý vị thế thông minh hơn, xem xét sự biến động của thị trường
- Thêm một số chỉ số để lọc các tín hiệu giả.
Tóm tắt
Chiến lược này xây dựng một hệ thống theo dõi xu hướng hoàn chỉnh bằng cách kết hợp EMA và RSI xác nhận. Ưu điểm chính của nó là kết hợp phân tích kỹ thuật với quản lý rủi ro một cách hữu cơ, có khả năng mở rộng và thích ứng tốt. Mặc dù có một số rủi ro vốn có, chiến lược này có thể cung cấp cho các nhà giao dịch một khung giao dịch vững chắc thông qua việc tối ưu hóa liên tục và điều chỉnh tham số.
- 1