Chiến lược giao dịch động lượng xu hướng đa chỉ báo dựa trên SuperTrend

Tổng quan
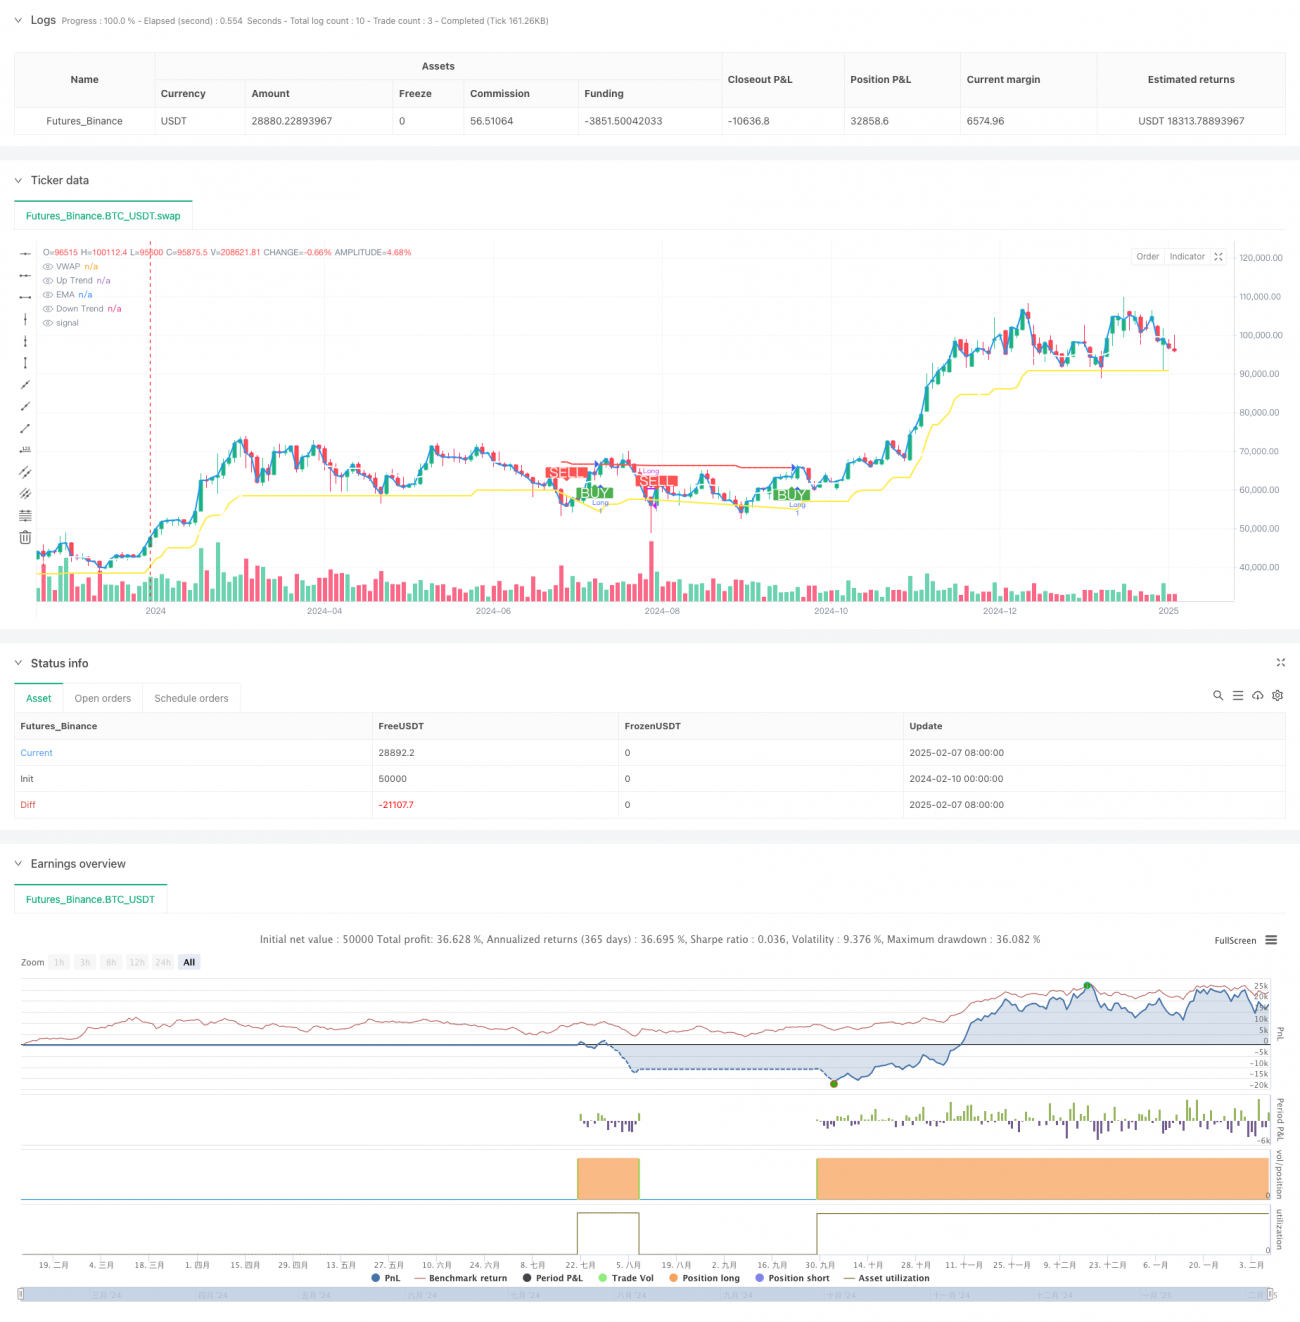
Đây là một chiến lược giao dịch theo dõi xu hướng kết hợp nhiều chỉ số kỹ thuật SuperTrend, VWAP, EMA và ADX. Chiến lược này chủ yếu sử dụng chỉ số SuperTrend để xác định hướng xu hướng và sử dụng mối quan hệ vị trí của VWAP và EMA để xác nhận xu hướng, đồng thời sử dụng chỉ số ADX để lọc xu hướng yếu, do đó cung cấp tín hiệu giao dịch chính xác. Chiến lược được thiết kế cho giao dịch trong ngày, đặc biệt là trên các chu kỳ thời gian như 5 phút, 15 phút và 1 giờ.
Nguyên tắc chiến lược
Lập luận cốt lõi của chiến lược dựa trên một số thành phần quan trọng sau:
- Chỉ số SuperTrend được tính bằng ATR 10 chu kỳ và số nhân của 3.0 để xác định hướng của xu hướng. Xu hướng đa đầu được hình thành khi giá phá vỡ đường lên ((xanh) và xu hướng không đầu được hình thành khi phá vỡ đường xuống ((đỏ)).
- 21 chu kỳ EMA được sử dụng như một hỗ trợ / kháng cự động, đồng thời xác nhận xu hướng với VWAP. Khi VWAP nằm trên EMA, có xu hướng đa đầu; ngược lại, có xu hướng không đầu.
- Chỉ số ADX được sử dụng để đo cường độ của xu hướng, khi giá trị ADX lớn hơn 25 cho thấy xu hướng mạnh mẽ, tín hiệu giao dịch đáng tin cậy hơn; khi thấp hơn 25 cho thấy xu hướng yếu, cần thận trọng.
- Điều kiện nhập học bao gồm:
Tín hiệu mua: SuperTrend chuyển sang màu xanh lá cây (các xu hướng tăng lên được xác nhận), giá đóng cửa trên VWAP và EMA, ADX cho thấy cường độ của xu hướng.
Bán tín hiệu: SuperTrend chuyển sang màu đỏ (các xác nhận xu hướng giảm), giá đóng cửa dưới VWAP và EMA, ADX xác nhận sức mạnh của xu hướng giảm.
Lợi thế chiến lược
- Xác minh chéo đa chỉ số giúp tăng độ chính xác của tín hiệu giao dịch và giảm hiệu quả các đột phá giả.
- Các chỉ số của ADX đã lọc ra các xu hướng yếu, giúp tăng tỷ lệ thành công của giao dịch.
- Chiến lược cung cấp tín hiệu mua và bán rõ ràng, và có biểu tượng màu nền xu hướng, để dễ dàng thực hiện giao dịch.
- Các tham số có thể được điều chỉnh linh hoạt theo các thị trường khác nhau và các loại giao dịch, có khả năng thích ứng mạnh mẽ.
- Kết hợp các lợi thế của theo dõi xu hướng và giao dịch động lực, nó có thể mang lại lợi nhuận tốt hơn trong các trường hợp xu hướng mạnh.
Rủi ro chiến lược
- Các tín hiệu sai có thể xảy ra thường xuyên trong thị trường bất ổn, dẫn đến tổn thất liên tục.
- Việc sử dụng nhiều chỉ số có thể gây ra sự chậm trễ tín hiệu, ảnh hưởng đến thời gian nhập cảnh.
- Thiết lập tham số ATR có ảnh hưởng lớn đến hiệu suất của chiến lược, tham số không đúng có thể dẫn đến nhiễu quá mức hoặc tín hiệu kém.
- Trong một cuộc đảo chính nhanh chóng, phản ứng chiến lược có thể không kịp thời, dẫn đến việc rút lui.
Hướng tối ưu hóa chiến lược
- Có thể đưa ra chỉ số khối lượng giao dịch để xác nhận tính hiệu quả của đột phá giá thông qua khối lượng giao dịch.
- Xem xét thêm chức năng dừng lỗ và quản lý tài chính.
- Phát triển cơ chế tham số thích ứng để tự động điều chỉnh tham số ATR và ADX theo biến động của thị trường.
- Thêm chức năng nhận diện môi trường thị trường, tự động giảm vị trí hoặc tạm dừng giao dịch trong thị trường biến động.
- Tham gia nhiều công cụ phân tích cấu trúc thị trường, chẳng hạn như hỗ trợ kháng cự, đường xu hướng, để cải thiện độ chính xác của giao dịch.
Tóm tắt
Đây là một chiến lược theo dõi xu hướng có cấu trúc, logic rõ ràng. Bằng cách sử dụng nhiều chỉ số phối hợp, hiệu quả nâng cao độ tin cậy của tín hiệu giao dịch. Ưu điểm của chiến lược là tín hiệu rõ ràng, dễ thực hiện và có khả năng mở rộng tốt.
- 1