
Tổng quan
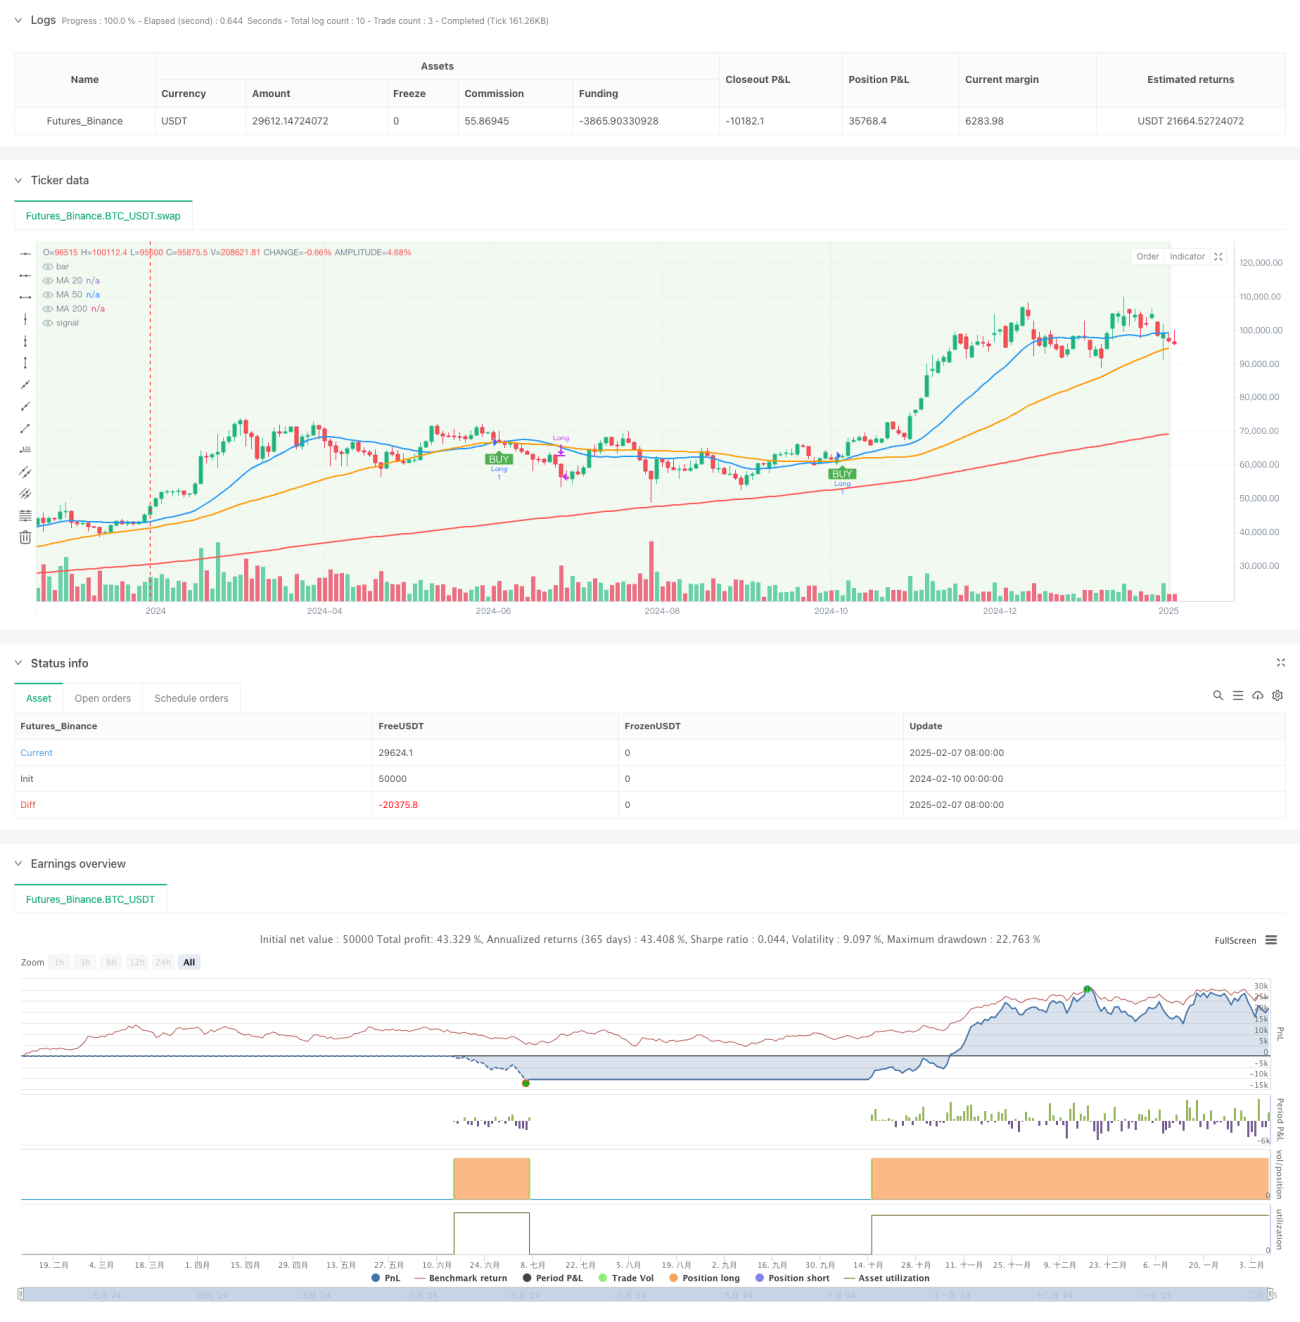
Đây là một chiến lược theo dõi xu hướng đường trung bình ba lần dựa trên phương pháp giao dịch Oliver Valez. Chiến lược này sử dụng tín hiệu chéo của 20 chu kỳ, 50 chu kỳ và 200 chu kỳ trung bình di chuyển để xác định xu hướng thị trường và cơ hội giao dịch. 200 chu kỳ trung bình hoạt động như bộ lọc xu hướng chính, và chéo của 20 chu kỳ và 50 chu kỳ trung bình được sử dụng để tạo ra tín hiệu giao dịch cụ thể.
Nguyên tắc chiến lược
Chiến lược này bao gồm ba khía cạnh quan trọng:
- Nhận định xu hướng: Sử dụng đường trung bình 200 chu kỳ làm đường phân chia xu hướng. Khi giá nằm trên đường trung bình 200, nó được coi là xu hướng tăng; Khi giá nằm dưới đường trung bình 200, nó được coi là xu hướng giảm.
- Tín hiệu giao dịch: Trong xu hướng tăng, khi đường trung bình 20 chu kỳ đi lên vượt qua đường trung bình 50 chu kỳ, kích hoạt nhiều tín hiệu; Trong xu hướng giảm, khi đường trung bình 20 chu kỳ đi xuống vượt qua đường trung bình 50 chu kỳ, kích hoạt tín hiệu trống.
- Kiểm soát rủi ro: Chiến lược đặt mức dừng lỗ 2% và 4% theo mặc định, đồng thời tự động thanh toán khi có tín hiệu chéo ngược.
Lợi thế chiến lược
- Cơ chế xác nhận đa dạng: cung cấp tín hiệu giao dịch đáng tin cậy hơn thông qua việc sử dụng kết hợp ba đường thẳng.
- Trình lọc xu hướng: Chức năng lọc xu hướng 200 đường thẳng có hiệu quả trong việc giảm nguy cơ phá vỡ giả.
- Tính linh hoạt: hỗ trợ chuyển đổi giữa SMA và EMA, có thể điều chỉnh tham số theo các đặc điểm thị trường khác nhau.
- Quản lý rủi ro tốt: Hệ thống ngăn chặn lỗ hổng tích hợp, bảo vệ an toàn tài chính.
- Hiệu ứng trực quan: hiển thị trực quan trạng thái xu hướng bằng cách thay đổi màu nền.
Rủi ro chiến lược
- Sự chậm trễ: Đường trung bình di chuyển là một chỉ số chậm trễ, có thể dẫn đến sự chậm trễ trong thời gian nhập cảnh hoặc xuất cảnh.
- Không áp dụng cho thị trường chấn động: Trong giai đoạn sắp xếp bảng ngang, việc giao nhau thường xuyên có thể tạo ra tín hiệu giả.
- Rủi ro dừng cố định: Sử dụng dừng phần trăm cố định có thể không phù hợp với tất cả các môi trường thị trường.
- Tính nhạy cảm của tham số: Các thiết lập chu kỳ trung bình khác nhau có thể tạo ra kết quả khác nhau đáng kể.
Hướng tối ưu hóa chiến lược
- Thêm phân tích lưu lượng giao dịch: Có thể thêm các chỉ số xác nhận lưu lượng giao dịch để tăng độ tin cậy tín hiệu.
- Cài đặt dừng động: Xem xét sử dụng ATR hoặc chỉ số tỷ lệ dao động để điều chỉnh động vị trí dừng.
- Thêm bộ lọc cường độ xu hướng: có thể giới thiệu các chỉ số cường độ xu hướng như ADX, lọc môi trường xu hướng yếu.
- Tối ưu hóa thời gian nhập cảnh: kết hợp hình dạng giá và ngưỡng kháng cự hỗ trợ để cải thiện độ chính xác nhập cảnh.
- Thêm bộ lọc thời gian: Bạn có thể thiết lập cửa sổ thời gian giao dịch để tránh các khoảng thời gian có biến động lớn.
Tóm tắt
Đây là một chiến lược theo dõi xu hướng có cấu trúc, logic rõ ràng. Bằng cách phối hợp hợp với đường trung bình ba, nó đảm bảo tính chính xác của nhận dạng xu hướng và cung cấp tín hiệu giao dịch rõ ràng. Cơ chế quản lý rủi ro của chiến lược tương đối hoàn hảo, nhưng vẫn có chỗ để tối ưu hóa.
- 1