Chiến lược giao dịch tối ưu hóa phạm vi mua quá mức và bán quá mức của đường trung bình động kép và RSI ngẫu nhiên

1
Follow
1781
Followers
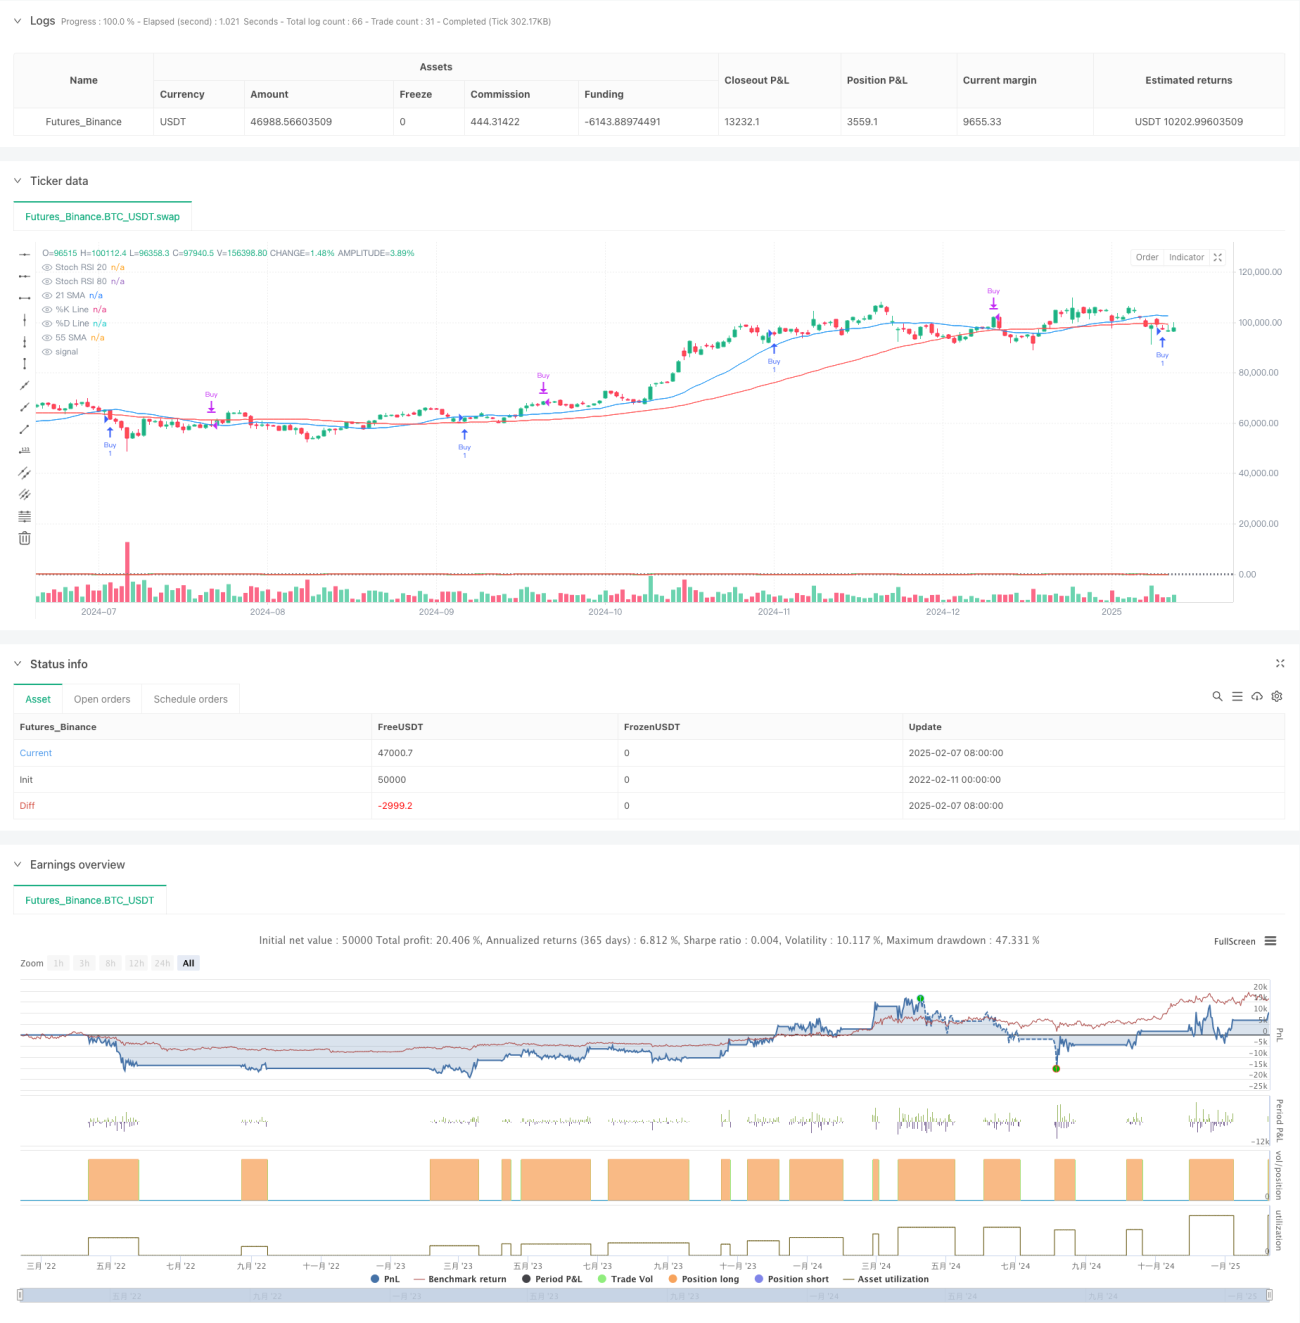
Tổng quan
Chiến lược này là một hệ thống giao dịch theo dõi xu hướng kết hợp hai đường trung bình và chỉ số RSI ngẫu nhiên. Xác định xu hướng thị trường thông qua đường trung bình di chuyển đơn giản 21 chu kỳ và chu kỳ 55, sử dụng các RSI ngẫu nhiên để tìm kiếm các điểm vào và điểm ra tốt nhất trong khu vực mua quá mức để tối ưu hóa giao dịch theo xu hướng.
Nguyên tắc chiến lược
Chiến lược này dựa trên logic cốt lõi sau:
- Xác nhận xu hướng: Sử dụng SMA 21 chu kỳ và SMA 55 chu kỳ, xác nhận xu hướng tăng khi đường trung bình ngắn hạn nằm trên đường trung bình dài hạn.
- Tín hiệu nhập: Sau khi xác nhận xu hướng, chờ đợi K-đường của RSI ngẫu nhiên ở vùng bán tháo dưới 20 với D-đường hình thành một đường giao thoa vàng.
- Tín hiệu xuất cảnh: Khi đường K của RSI ngẫu nhiên hình thành một đường giao thoa chết với đường D ở khu vực mua quá mức trên 80.
- Bộ lọc tín hiệu: Giảm hiệu quả tín hiệu giả bằng cách kết hợp xu hướng và động lực.
Lợi thế chiến lược
- Cơ chế xác nhận đa dạng: tăng độ tin cậy của giao dịch thông qua xác nhận kép xu hướng và động lực.
- Tối ưu hóa kiểm soát rủi ro: Sử dụng khoảng mua quá mức để chọn điểm vào tốt hơn theo hướng xu hướng.
- Khả năng thích ứng: Các tham số chiến lược có thể được điều chỉnh theo các đặc điểm thị trường khác nhau.
- Tín hiệu rõ ràng: Điều kiện nhập cảnh và xuất cảnh rõ ràng, dễ thực hiện.
- Mức độ hệ thống hóa cao: logic chiến lược được hệ thống hóa hoàn toàn, ít phán đoán chủ quan hơn.
Rủi ro chiến lược
- Rủi ro thị trường biến động: Có thể xảy ra giao dịch thường xuyên trong thị trường biến động ngang.
- Rủi ro bị tụt hậu: Đường trung bình di chuyển có thể bị tụt hậu, có thể bỏ lỡ thời điểm tốt nhất để nhập cảnh.
- Rủi ro phá vỡ giả: RSI ngẫu nhiên có thể tạo ra tín hiệu giả trong thị trường biến động.
- Độ nhạy của tham số: Các kết hợp tham số khác nhau có thể dẫn đến sự khác biệt lớn về hiệu suất chiến lược.
Hướng tối ưu hóa chiến lược
- Thêm bộ lọc biến động: giới thiệu chỉ số ATR để giảm tần suất giao dịch trong thời gian biến động thấp.
- Tối ưu hóa cơ chế ra sân: Có thể xem xét thêm mục tiêu dừng lỗ hoặc lợi nhuận di động.
- Phân loại môi trường thị trường: Điều chỉnh tham số theo động thái môi trường thị trường khác nhau.
- Tăng xác nhận lượng giao dịch: Thêm chỉ số lượng giao dịch để xác nhận hiệu quả của tín hiệu.
- Tiếp theo là các chỉ số cường độ xu hướng như ADX, được sử dụng để lọc các môi trường xu hướng yếu.
Tóm tắt
Chiến lược này được xây dựng bằng cách kết hợp các chỉ số kỹ thuật cổ điển để xây dựng một hệ thống giao dịch theo dõi xu hướng hoàn chỉnh. Chiến lược này được tăng cường độ tin cậy bằng cách xác nhận nhiều tín hiệu trong khi vẫn đơn giản và trực quan. Với sự tối ưu hóa tham số hợp lý và quản lý rủi ro, chiến lược này có giá trị thực tế tốt.
Source
Pine
Strategy parameters
Related strategies
Comment
All comments (0)
No data
- 1