
Tổng quan
Chiến lược này là một hệ thống giao dịch theo dõi xu hướng sáng tạo, sử dụng công nghệ làm mịn chỉ số hai lớp để xác định xu hướng thị trường. Hệ thống này tạo ra hai đường xu hướng để nắm bắt các động thái ngắn hạn và dài hạn của thị trường bằng cách xử lý dữ liệu giá theo chỉ số đặc biệt. Hệ thống tích hợp mô-đun quản lý rủi ro hoàn chỉnh, bao gồm cài đặt dừng lỗ và chức năng quản lý vị trí linh hoạt.
Nguyên tắc chiến lược
Cốt lõi của chiến lược là thuật toán làm mịn chỉ số hai tầng độc đáo của nó. Đầu tiên, hệ thống xử lý trọng lượng cho giá đóng cửa, tính toán theo phương pháp ((giá cao nhất + giá thấp nhất + 2*Khi đường cong ngắn hạn đi qua đường cong dài hạn, hệ thống sẽ tạo ra tín hiệu giao dịch. Đi trên sẽ tạo ra tín hiệu đa và đi dưới sẽ tạo ra tín hiệu trống. Hệ thống cũng bao gồm hệ thống quản lý vị trí dựa trên tỷ lệ phần trăm, giao dịch theo mặc định với 100% tài khoản.
Lợi thế chiến lược
- Cơ chế tạo tín hiệu rõ ràng, theo dõi xu hướng cổ điển, dễ hiểu và dễ thực hiện.
- Công nghệ làm mịn chỉ số kép có thể lọc hiệu quả tiếng ồn thị trường, cải thiện chất lượng tín hiệu.
- Một hệ thống quản lý rủi ro được tích hợp đầy đủ, bao gồm dừng lỗ và quản lý vị trí.
- Hệ thống có thể thích ứng với các môi trường thị trường khác nhau và phù hợp với nhiều loại giao dịch.
- Nó cung cấp các chỉ số thị giác rõ ràng, giúp các nhà giao dịch nhanh chóng đánh giá được xu hướng của thị trường.
Rủi ro chiến lược
- Các tín hiệu sai có thể xảy ra thường xuyên trong thị trường chấn động, dẫn đến tổn thất liên tục.
- Lưu ý rằng các giao dịch được thực hiện với 100% vốn là mặc định, và tỷ lệ đòn bẩy quá cao có thể gây ra rủi ro lớn.
- Cài đặt dừng lỗ với số điểm cố định có thể không phù hợp với tất cả các môi trường thị trường.
- Hệ thống có thể bị trượt trong thị trường biến động mạnh, ảnh hưởng đến hiệu quả thực hiện.
- Những kết quả đánh giá lịch sử không đảm bảo hiệu suất trong tương lai.
Hướng tối ưu hóa chiến lược
- Tiến hành các chỉ số biến động (ví dụ như ATR) để động điều chỉnh điểm dừng.
- Tăng bộ lọc cường độ xu hướng và giảm tần suất giao dịch trong môi trường xu hướng yếu.
- Thêm mô-đun nhận diện môi trường thị trường để tự động điều chỉnh các tham số chiến lược trong thị trường biến động.
- Phát triển hệ thống quản lý vị thế động, tự động điều chỉnh quy mô giao dịch theo tình hình thị trường.
- Tích hợp các mô-đun phân tích cơ bản để tăng độ chính xác của các quyết định giao dịch.
Tóm tắt
Đây là một hệ thống theo dõi xu hướng được thiết kế hợp lý, logic rõ ràng. Với kỹ thuật làm mịn chỉ số kép và hệ thống quản lý rủi ro đầy đủ, chiến lược này có thể hoạt động tốt trong thị trường xu hướng. Tuy nhiên, người dùng cần điều chỉnh kích thước vị trí tùy theo khả năng chịu rủi ro của mình và khuyến nghị kiểm tra lại đầy đủ trước khi giao dịch trực tiếp.
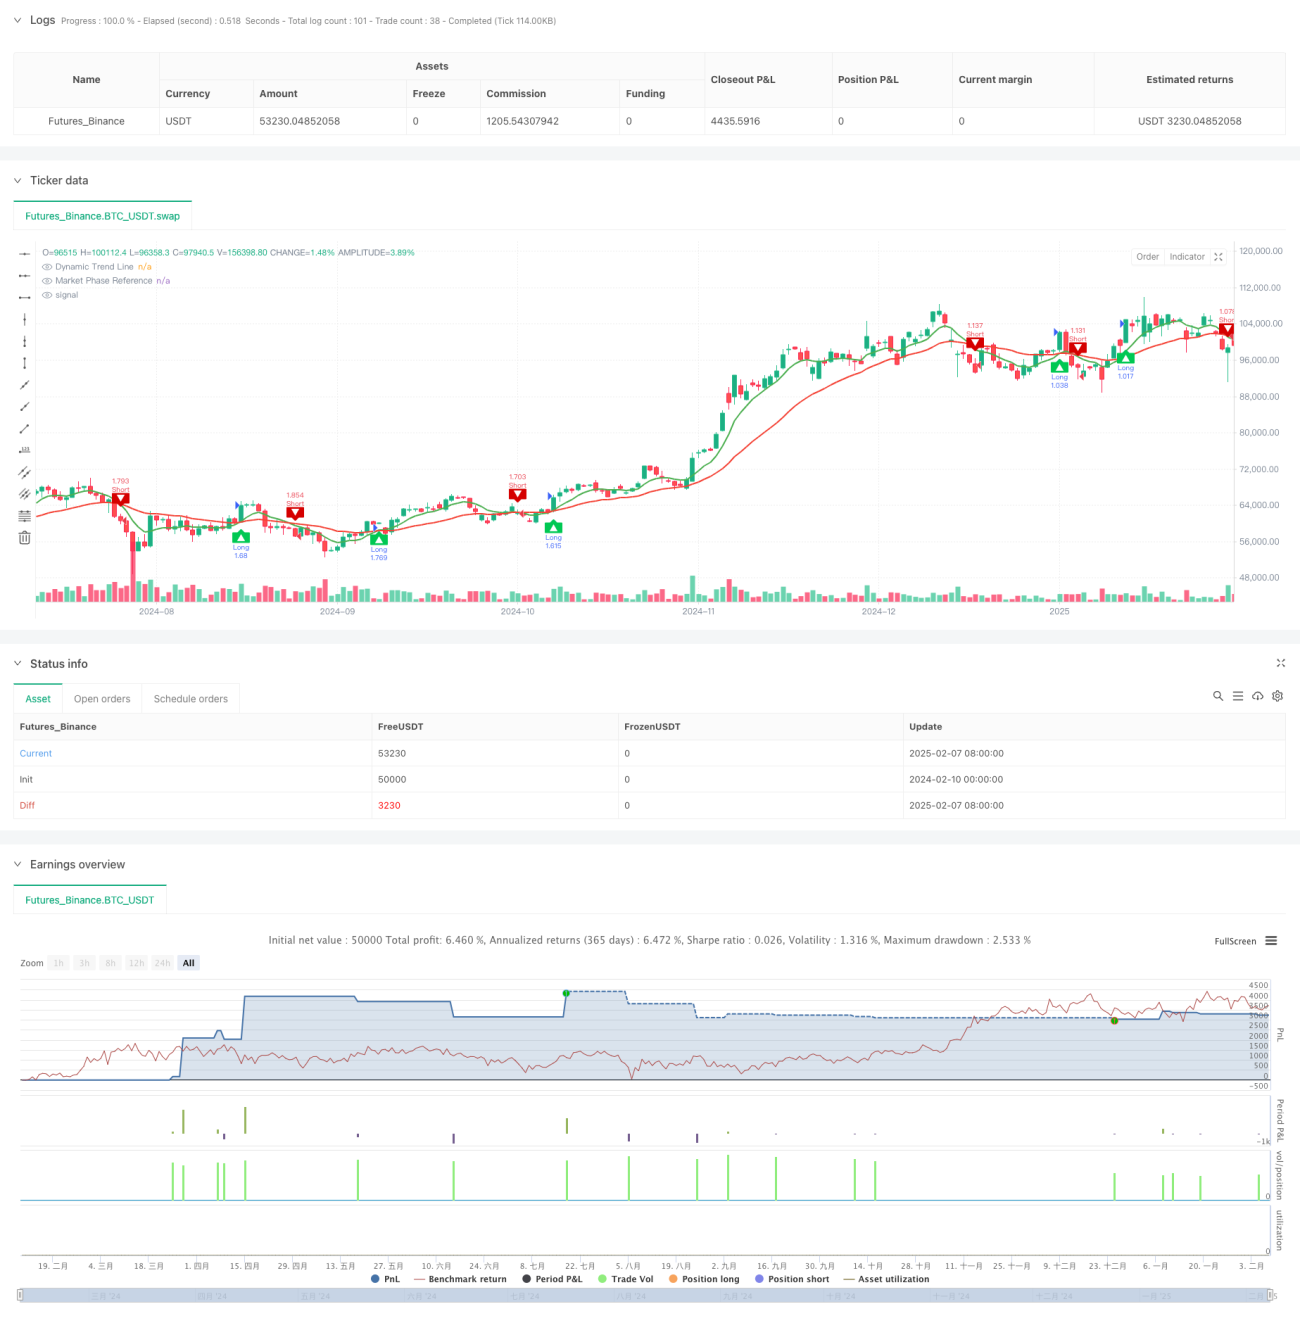
/*backtest
start: 2024-02-10 00:00:00
end: 2025-02-08 08:00:00
period: 1d
basePeriod: 1d
exchanges: [{"eid":"Futures_Binance","currency":"BTC_USDT"}]
*/

//@version=5
strategy("Dynamic Trend Navigator AI [CodingView]", overlay=true, initial_capital=100000, default_qty_type=strategy.percent_of_equity , default_qty_value=200 )
- 1