Chiến lược động lượng xu hướng - Hệ thống thời gian dải động đa chu kỳ Zigzag

Tổng quan
Chiến lược này là một hệ thống giao dịch đa chiều kết hợp các chỉ số ZigZag và William. Bằng cách sử dụng chỉ số ZigZag để xác định các điểm cao và thấp của một dải quan trọng, đồng thời sử dụng chỉ số William để xác nhận điểm vào khi thị trường đạt đến trạng thái quá mua hoặc quá bán. Sự kết hợp này không chỉ có thể nắm bắt các điểm biến đổi xu hướng chính của thị trường mà còn có thể cải thiện độ chính xác của giao dịch bằng cách xác nhận động lực.
Nguyên tắc chiến lược
Chiến lược này dựa trên hai yếu tố chính:
- Chỉ số chữ bằng cách thiết lập độ sâu và tham số sai lệch để xác định các điểm cao và thấp của một làn sóng đáng kể, lọc tiếng ồn thị trường và xác định hướng xu hướng. Khi một làn sóng thấp mới được hình thành, nó sẽ cho thấy xu hướng tăng bắt đầu, và một làn sóng cao mới sẽ cho thấy xu hướng giảm bắt đầu.
- Chỉ số William tính toán trạng thái động lực của thị trường bằng cách so sánh giá hiện tại với giá cao nhất trong một chu kỳ nhất định. Khi chỉ số vượt 80 thì biểu thị quá bán ((khả năng mua tiềm năng) và vượt 20 thì biểu thị quá mua ((khả năng bán tiềm năng).
Quy tắc giao dịch của chiến lược là:
- Làm nhiều điều kiện: Chỉ số chữ cái xác định mức thấp của dải sóng mới và chỉ số William đột phá từ khu vực bán tháo
- Điều kiện làm trống: Chỉ số hình chữ xác định mức cao của dải sóng mới và chỉ số William thoát ra khỏi khu vực mua quá mức
- Stop Loss là 1% và Stop Loss là 2%
Lợi thế chiến lược
- Xác nhận đa chiều: Tăng độ tin cậy của tín hiệu giao dịch thông qua xác nhận kép xu hướng và động lực
- Khả năng thích ứng mạnh mẽ: các tham số sai lệch của chỉ số hình chữ có thể được điều chỉnh theo sự biến động của thị trường
- Kiểm soát rủi ro hoàn hảo: sử dụng chiến lược dừng lỗ ở tỷ lệ cố định để kiểm soát rủi ro trên mỗi giao dịch
- Hiển thị hiệu quả: hiển thị rõ ràng các tín hiệu giao dịch thông qua các thẻ và đồ họa, giúp phân tích và tối ưu hóa
Rủi ro chiến lược
- Rủi ro thị trường chấn động: Có thể xảy ra các tín hiệu phá vỡ sai lệch thường xuyên trên thị trường ngang
- Rủi ro trượt: Có thể có trượt lớn hơn trong điều kiện nhanh
- Nhận thức tham số: sự lựa chọn tham số chỉ số có ảnh hưởng lớn đến hiệu suất chiến lược
- Trễ tín hiệu: Có thể bỏ lỡ một số hoạt động nhanh vì cần xác nhận hình thành điểm băng tần mới
Hướng tối ưu hóa chiến lược
- Thêm bộ lọc môi trường thị trường: có thể thêm chỉ số biến động để xác định trạng thái thị trường, sử dụng các thiết lập tham số khác nhau trong các môi trường khác nhau
- Tối ưu hóa dừng động: có thể điều chỉnh vị trí dừng động dựa trên ATR hoặc tỷ lệ dao động
- Tiết xuất xác nhận giao dịch: tăng xác nhận giao dịch khi tín hiệu được tạo
- Bộ lọc thời gian: có thể thêm bộ lọc thời gian giao dịch để tránh giao dịch trong thời gian có biến động lớn
Tóm tắt
Đây là một hệ thống giao dịch hoàn chỉnh kết hợp theo dõi xu hướng và giao dịch động lực. Với sự phối hợp của nhiều chỉ số kỹ thuật, có thể kiểm soát rủi ro hiệu quả trong khi duy trì tỷ lệ thắng cao. Mặc dù có một số sự chậm trễ, nhưng có thể đạt được hiệu quả giao dịch ổn định thông qua tối ưu hóa tham số và quản lý rủi ro hợp lý. Chiến lược này đặc biệt phù hợp với tình hình xu hướng trung và dài hạn, hoạt động tốt hơn khi thị trường có cơ hội định hướng rõ ràng.
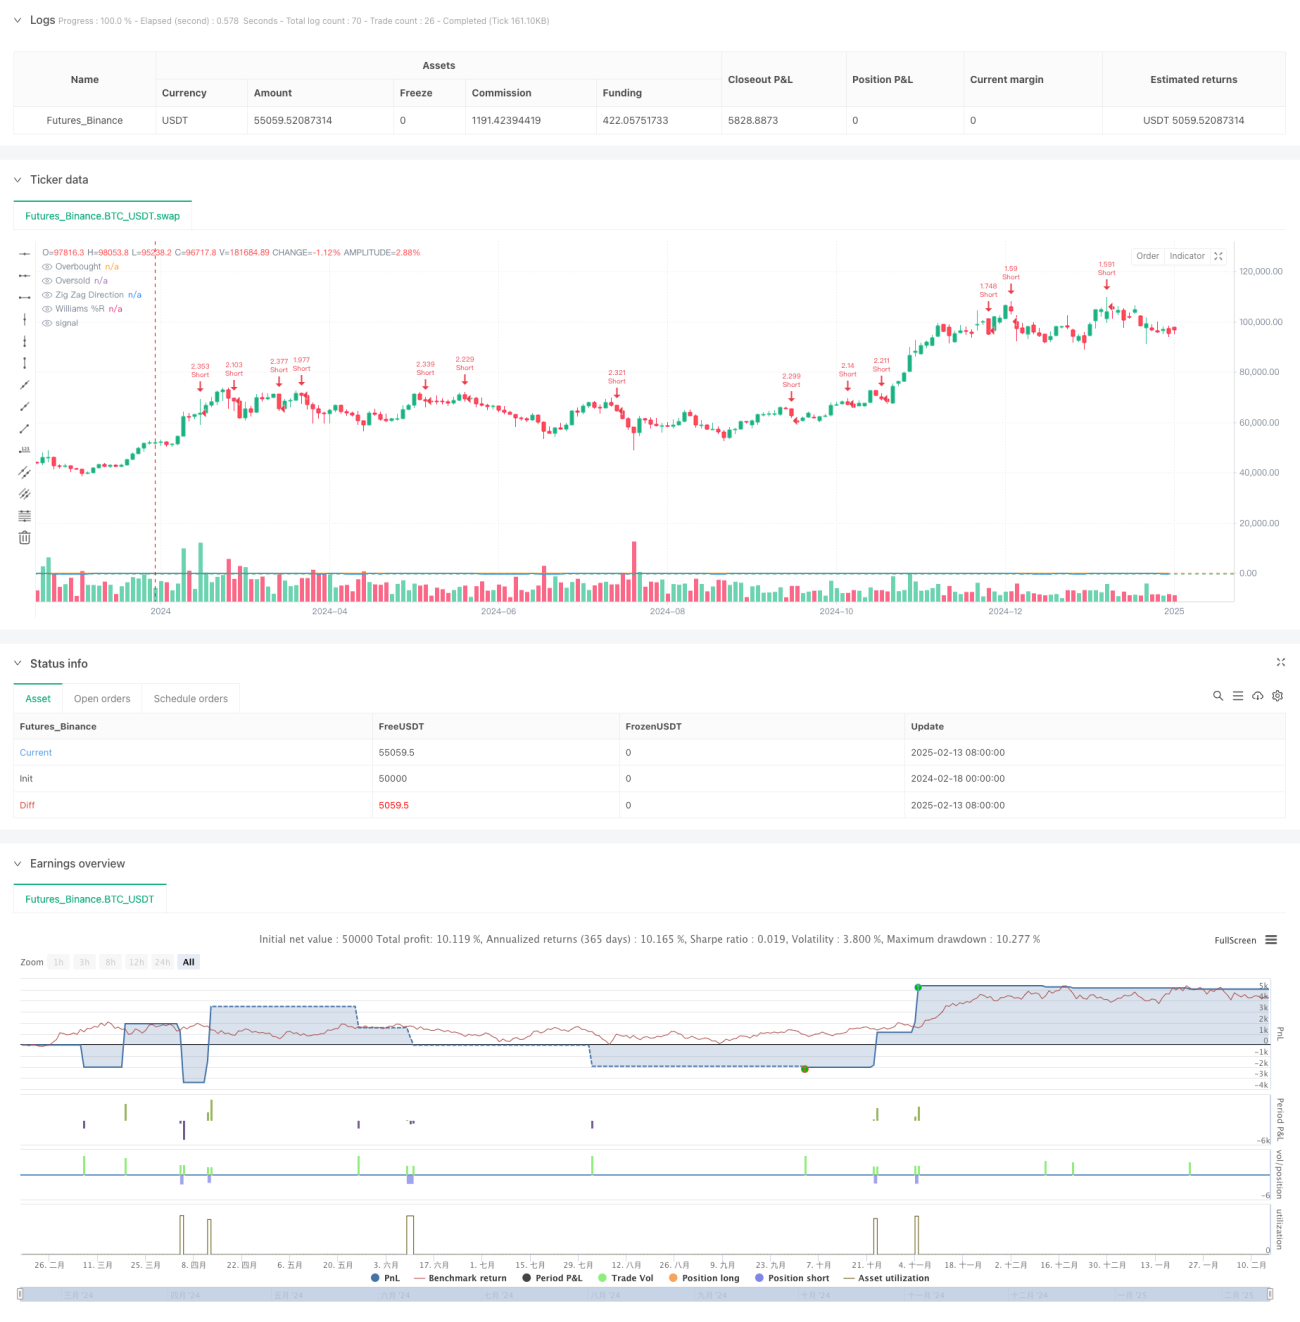
/*backtest
start: 2024-02-18 00:00:00
end: 2025-02-15 08:00:00
period: 2d
basePeriod: 2d
exchanges: [{"eid":"Futures_Binance","currency":"BTC_USDT"}]
*/

//@version=6
strategy("Zig Zag + Williams %R Strategy", overlay=true, default_qty_type=strategy.percent_of_equity, default_qty_value=300)

// ====================- 1