Chiến lược đảo ngược xu hướng đa chỉ báo dựa trên động lượng và khối lượng

Tổng quan
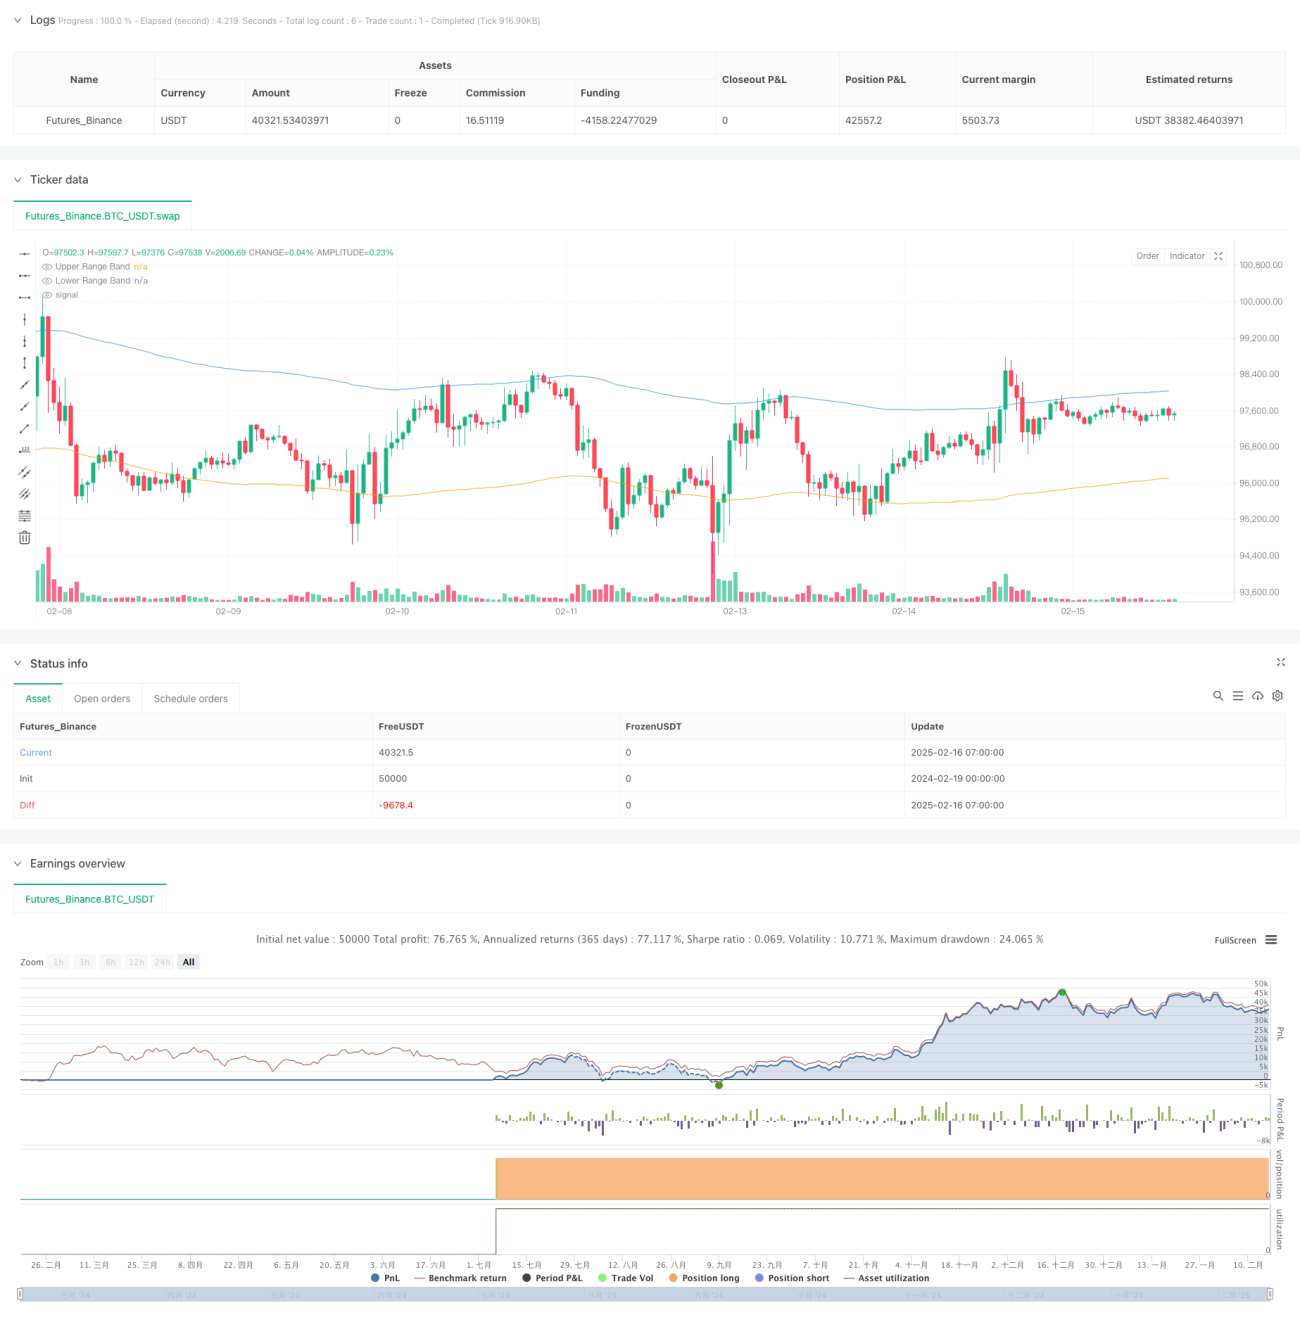
Chiến lược này là một hệ thống giao dịch đảo ngược xu hướng kết hợp các chỉ số động lực (MACD, RSI) và bộ lọc khối lượng giao dịch. Bằng cách giới thiệu bộ lọc phạm vi (Range Filter), giám sát biến động giá, để nắm bắt chính xác các đỉnh và đáy của thị trường. Chiến lược này đã thêm vào cơ chế xác nhận khối lượng giao dịch dựa trên các chỉ số kỹ thuật truyền thống, làm tăng hiệu quả độ tin cậy của tín hiệu giao dịch.
Nguyên tắc chiến lược
Chiến lược này sử dụng nhiều phương thức xác thực:
- Chỉ số MACD được sử dụng để nắm bắt sự thay đổi trong động thái giá, xác nhận điểm chuyển hướng bằng đường nhanh và đường chậm
- Chỉ số RSI theo dõi tình trạng quá mua và quá bán của thị trường, tìm kiếm cơ hội đảo ngược tiềm năng khi RSI đạt đến cực điểm
- Bộ lọc phạm vi đảm bảo giao dịch xảy ra ở các vị trí có xu hướng lệch đáng kể bằng cách tính toán các dải phạm vi mịn của giá
- Bộ lọc khối lượng giao dịch yêu cầu tín hiệu giao dịch phải được xác nhận bằng khối lượng, tăng độ tin cậy của tín hiệu
Các tác nhân của đa điều kiện là:
- Các điều kiện khác: MACD Gold Forks + RSI nằm trong khu vực bán tháo + Giá thấp hơn đường ray dưới + khối lượng giao dịch vượt mức trung bình
- Điều kiện làm rỗng: MACD dead fork + RSI nằm trong vùng quá mua + Giá cao hơn đường ray trên + khối lượng giao dịch vượt mức trung bình
Lợi thế chiến lược
- Xác minh chéo của nhiều chỉ số cải thiện độ chính xác của tín hiệu và giảm hiệu quả nhiễu tín hiệu giả
- Việc giới thiệu bộ lọc phạm vi đảm bảo giao dịch xảy ra ở vị trí giá lệch đáng kể, tăng không gian thu nhập tiềm năng
- Cơ chế xác nhận khối lượng giao dịch tránh sai lầm trong môi trường thiếu thanh khoản, tăng cường độ tin cậy của giao dịch
- Các tham số chiến lược có thể được điều chỉnh linh hoạt để phù hợp với các đặc điểm của môi trường thị trường và các loại giao dịch khác nhau
- Logic tạo tín hiệu rõ ràng cho phép giám sát và phân tích phản hồi trong thời gian thực
Rủi ro chiến lược
- Các yêu cầu nghiêm ngặt về nhiều điều kiện có thể dẫn đến việc bỏ lỡ một số cơ hội giao dịch tiềm năng
- Các tín hiệu giao dịch thường xuyên có thể được tạo ra trong một thị trường biến động, làm tăng chi phí giao dịch
- Lựa chọn tham số cần được hỗ trợ bởi kinh nghiệm thị trường đầy đủ và dữ liệu lịch sử
- Trong một môi trường thị trường khắc nghiệt, hiệu quả của các chỉ số kỹ thuật có thể bị ảnh hưởng
Đề xuất kiểm soát rủi ro:
- Khuyến nghị tối ưu hóa tham số đầy đủ và xác minh phản hồi
- Cân nhắc việc áp dụng hệ thống ngăn chặn thiệt hại
- Theo dõi sự thay đổi của môi trường thị trường, điều chỉnh các tham số chiến lược kịp thời
Hướng tối ưu hóa chiến lược
- Tiến hành cơ chế tham số thích ứng, điều chỉnh tham số chỉ số theo động thái biến động của thị trường
- Thêm mô-đun nhận diện môi trường thị trường, áp dụng các quy tắc lọc tín hiệu khác nhau trong các trạng thái thị trường khác nhau
- Tối ưu hóa bộ lọc khối lượng giao dịch, xem xét việc đưa vào phân tích hình dạng khối lượng giao dịch
- Thêm tính năng nhận dạng hình dạng giá để cung cấp thêm tín hiệu xác nhận đảo ngược
- Phát triển mô-đun quản lý tài sản thông minh, tối ưu hóa quy mô và kiểm soát rủi ro
Tóm tắt
Chiến lược này tạo ra một hệ thống giao dịch đảo ngược xu hướng tương đối hoàn hảo thông qua sự phối hợp phối hợp của nhiều chỉ số kỹ thuật. Điểm mạnh cốt lõi của chiến lược là cơ chế lọc tín hiệu nghiêm ngặt và không gian điều chỉnh tham số linh hoạt. Bằng cách liên tục tối ưu hóa và hoàn thiện, chiến lược có khả năng duy trì hiệu suất ổn định trong nhiều môi trường thị trường.
- 1