
Tổng quan
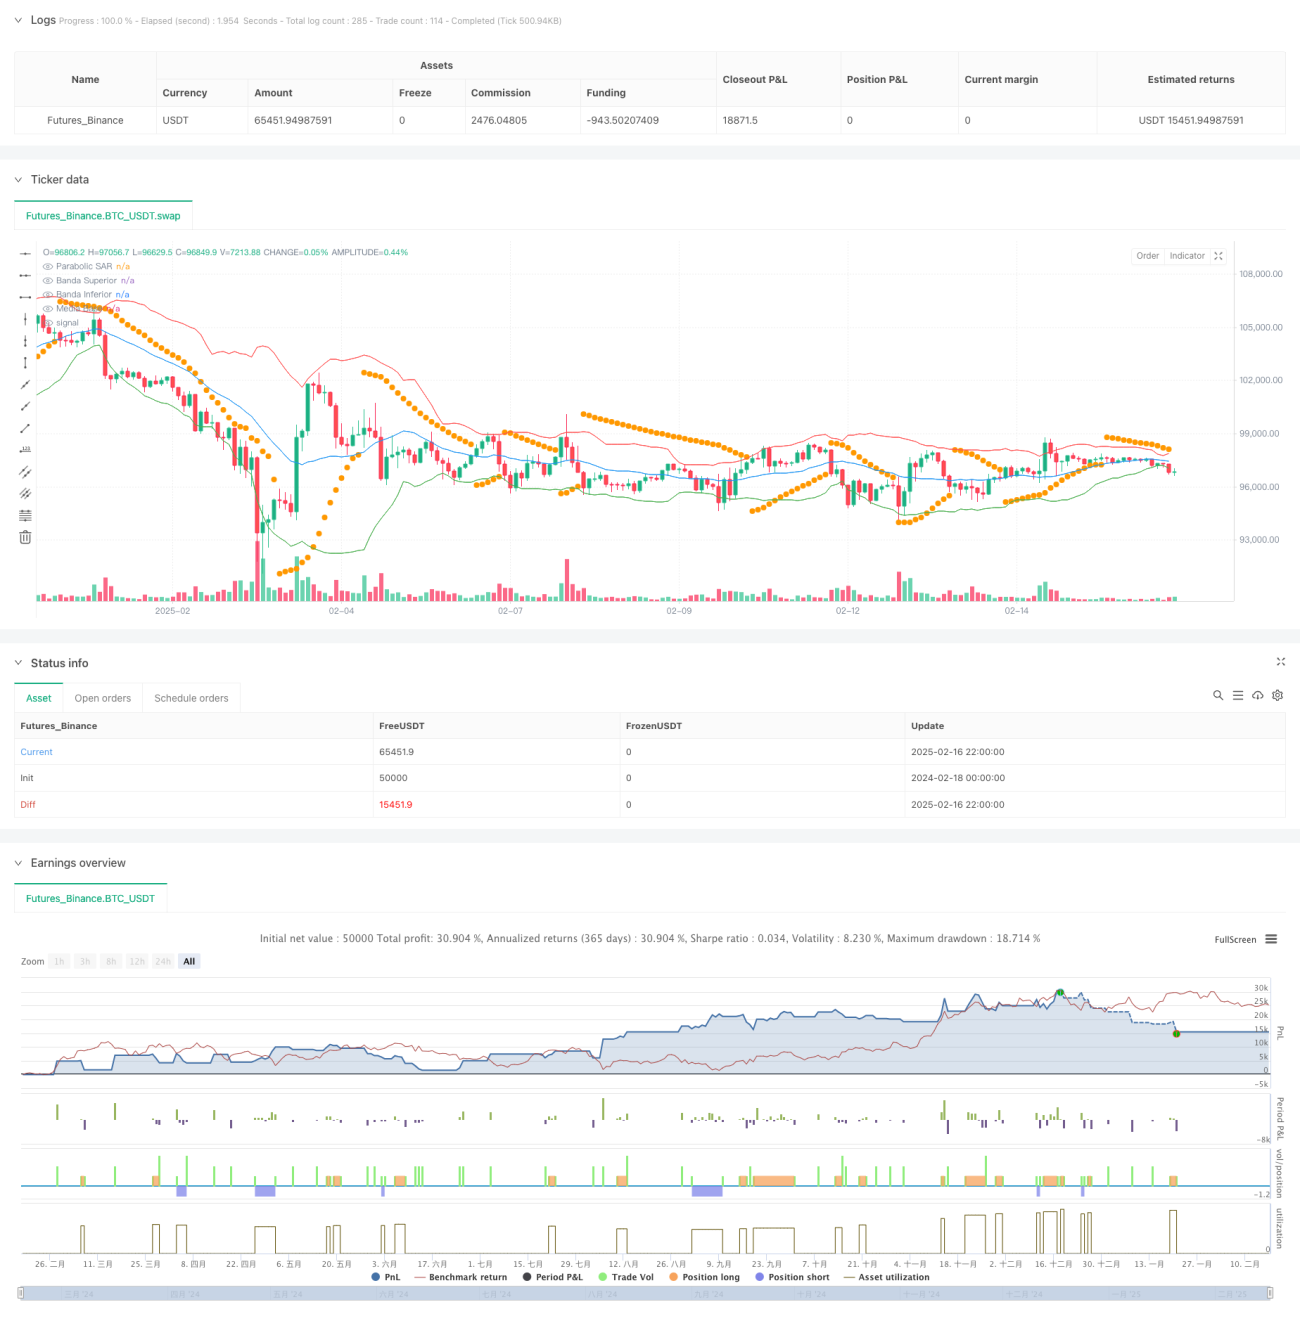
Đây là một chiến lược giao dịch tổng hợp kết hợp các chỉ số chuyển hướng Brin và Parallax (PSAR), sử dụng tỷ lệ lợi nhuận rủi ro cố định để quản lý giao dịch. Chiến lược này hoạt động chủ yếu trong thời gian giao dịch trong ngày, xác định cơ hội giao dịch thông qua giá phá vỡ Brin và hình ảnh phác họa, đồng thời xác nhận xu hướng bằng chỉ số PSAR. Chiến lược sử dụng thiết lập mục tiêu dừng lỗ và lợi nhuận động, duy trì tỷ lệ lợi nhuận rủi ro là 1: 3.
Nguyên tắc chiến lược
Chiến lược sử dụng nhiều chỉ số kỹ thuật để xác nhận tín hiệu giao dịch:
- Sử dụng dải Brin 20 chu kỳ làm chỉ số chính cho phạm vi biến động giá
- Thông qua chỉ số PSAR ((giá ban đầu là 0.02, giá trị tối đa là 0.2) như một công cụ xác nhận xu hướng
- Tính tỷ lệ thực thể dây chuyền ((dài thực thể / tổng chiều dài ≥ 0.33) để đảm bảo độ tin cậy của tín hiệu
- Thực hiện giao dịch trong cửa sổ thời gian giao dịch được chỉ định (GMT-5 7:30-16:00)
- Điều kiện nhập cảnh đa đầu: Giá đóng cửa phá vỡ đường ray và tỷ lệ thực thể thép đáp ứng yêu cầu
- Điều kiện đầu vào không: giá đóng cửa phá vỡ đường mòn và tỷ lệ thực thể nhựa đáp ứng yêu cầu
Lợi thế chiến lược
- Kết hợp nhiều chỉ số kỹ thuật để cải thiện độ tin cậy tín hiệu
- Sử dụng tỷ lệ lợi nhuận / rủi ro cố định ((1:3)), có lợi cho lợi nhuận ổn định lâu dài
- Bộ lọc theo thời gian, tránh nhiễu trong thời gian lưu động thấp
- Sử dụng bộ lọc tỷ lệ thực thể silicon để giảm đột phá giả
- Đặt mục tiêu dừng lỗ và lợi nhuận động để thích ứng với biến động của thị trường
- Chiến lược logic rõ ràng, dễ hiểu và tối ưu hóa
Rủi ro chiến lược
- Có thể có điểm trượt trong thị trường biến động cao
- Tỷ lệ lợi nhuận rủi ro cố định có thể bị bỏ lỡ một số cơ hội lợi nhuận
- Chọn thời gian có thể bỏ lỡ cơ hội thị trường quan trọng
- Nhiều chỉ báo có thể gây ra độ trễ tín hiệu
- Có thể gây ra tổn thất liên tục trong thị trường bất ổn
Hướng tối ưu hóa chiến lược
- Giới thiệu chu kỳ Brinh tự điều chỉnh để thích ứng với các điều kiện thị trường khác nhau
- Phát triển cơ chế cơ động rủi ro lợi nhuận so với thiết lập
- Thêm chỉ báo âm lượng làm xác nhận phụ trợ
- Tối ưu hóa các tham số PSAR để cải thiện hiệu quả theo dõi xu hướng
- Tham gia bộ lọc biến động thị trường
- Phát triển bộ lọc thời gian thông minh hơn
Tóm tắt
Chiến lược này xây dựng một hệ thống giao dịch hoàn chỉnh bằng cách sử dụng tổng hợp các chỉ số Brin, PSAR và phân tích đồ thị. Điểm mạnh cốt lõi của chiến lược là sự phối hợp của nhiều chỉ số kỹ thuật và quản lý rủi ro nghiêm ngặt. Mặc dù có một số rủi ro vốn có, nhưng theo hướng tối ưu hóa được đề xuất có thể nâng cao hơn nữa sự ổn định và lợi nhuận của chiến lược. Chiến lược đặc biệt phù hợp cho người sử dụng giao dịch trong ngày, có thể nhận được lợi nhuận ổn định trong khi kiểm soát rủi ro.
- 1