Chiến lược giao dịch sàng lọc tín hiệu Bollinger Band Crossover

Tổng quan
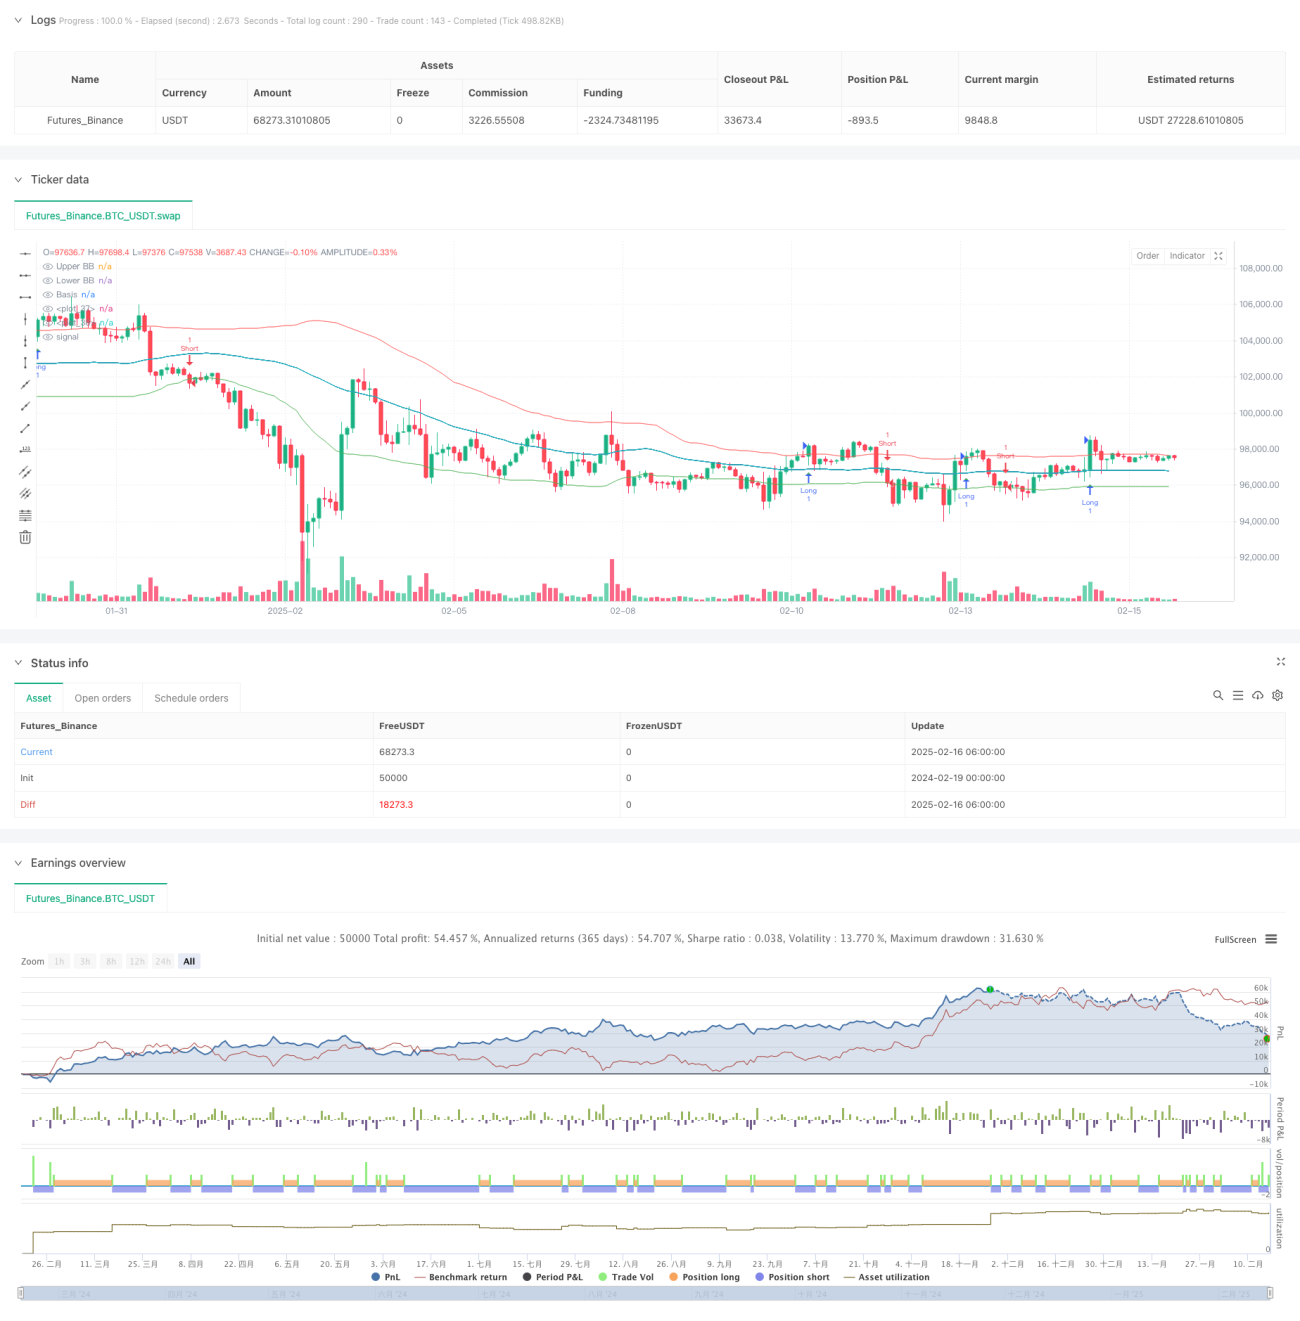
Đây là một chiến lược giao dịch dựa trên các chỉ số Bollinger Bands để xác định xu hướng thị trường và tạo ra tín hiệu giao dịch thông qua mối quan hệ chéo giữa giá và Bollinger Bands. Chiến lược này sử dụng đường trung bình di chuyển 55 chu kỳ làm đường trung tâm của Bollinger Bands và tính toán dựa trên chênh lệch chuẩn gấp 1.0 lần đường trên và đường dưới của Bollinger Bands.
Nguyên tắc chiến lược
Các hoạt động chính của chiến lược bao gồm các phần quan trọng sau:
- Tính toán Brinband: Sử dụng trung bình di chuyển đơn giản 55 chu kỳ ((SMA) làm đường ray trung bình, chênh lệch chuẩn nhân là 1.0, tính trên và dưới đường ray.
- Hình thức tạo tín hiệu:
- Khi giá đóng cửa phá vỡ đường ray, tạo ra nhiều tín hiệu
- Khi giá đóng cửa phá vỡ đường mòn, tạo ra tín hiệu dừng lỗ
- Cơ chế xác nhận tín hiệu: Sử dụng hàm barssince để tính toán số chu kỳ từ khoảng cách đột phá trước, xác định hướng giao dịch cuối cùng bằng cách so sánh khoảng cách chu kỳ của tín hiệu trống.
- Phần trực quan: Hiển thị tín hiệu giao dịch bằng cách đánh dấu tam giác trên biểu đồ, sử dụng các màu sắc khác nhau để phân biệt nhiều không gian.
Lợi thế chiến lược
- Tín hiệu rõ ràng: Tạo tín hiệu giao dịch thông qua mối quan hệ chéo rõ ràng giữa giá và vùng Brin, tránh vùng mờ.
- Theo xu hướng: Chiến lược này theo xu hướng, có thể mang lại lợi nhuận tốt hơn trong một tình huống mạnh mẽ.
- Hình ảnh trực quan: Nhận ra tín hiệu giao dịch rất trực quan thông qua màu sắc và hình dạng.
- Các tham số linh hoạt: Chu kỳ và tỷ lệ chênh lệch chuẩn của Brin có thể được điều chỉnh theo các điều kiện thị trường khác nhau.
- Hệ thống hoàn chỉnh: bao gồm các chức năng phát tín hiệu, hiển thị và báo động hoàn chỉnh.
Rủi ro chiến lược
- Rủi ro thị trường chấn động: Có thể tạo ra các tín hiệu sai lệch thường xuyên trong thị trường chấn động ngang.
- Rủi ro về độ trễ: Do sử dụng đường trung bình di chuyển có chu kỳ dài ((55)), tín hiệu có thể có độ trễ.
- Rủi ro đảo ngược: Có thể chịu được sự rút lui lớn hơn khi xu hướng đột ngột đảo ngược.
- Tính nhạy cảm của tham số: Chọn tham số trong dải Brin có ảnh hưởng lớn đến hiệu suất của chiến lược.
Hướng tối ưu hóa chiến lược
- Ghi nhận khối lượng giao dịch: Có thể thêm chỉ số khối lượng giao dịch làm điều kiện phụ trợ cho tín hiệu xác nhận.
- Tối ưu hóa tham số động: Tỷ lệ chênh lệch tiêu chuẩn của vùng Brin có thể được điều chỉnh theo động lực biến động của thị trường.
- Thêm bộ lọc xu hướng: Có thể thêm các chỉ số xu hướng có chu kỳ dài hơn để lọc các tín hiệu giả.
- Cải thiện cơ chế dừng lỗ: Cố gắng tăng dừng di động hoặc dừng cố định để kiểm soát rủi ro.
- Phân loại trạng thái thị trường: Có thể thêm mô-đun nhận dạng trạng thái thị trường, sử dụng các thiết lập tham số khác nhau trong các trạng thái thị trường khác nhau.
Tóm tắt
Đây là một chiến lược theo dõi xu hướng cổ điển dựa trên Brin Belt, để nắm bắt xu hướng thị trường thông qua sự liên kết chéo giữa giá và Brin Belt. Thiết kế chiến lược được thiết kế đơn giản và rõ ràng, có hiệu quả hiển thị tốt và cơ chế tạo tín hiệu. Mặc dù có thể gặp thách thức trong thị trường bất ổn, nhưng sự ổn định và độ tin cậy của chiến lược có thể được nâng cao hơn nữa bằng cách tối ưu hóa tham số thích hợp và thêm các chỉ số hỗ trợ.
- 1