Nhiều mức hỗ trợ và kháng cự chồng lên chiến lược giao dịch đảo ngược động lượng

Tổng quan
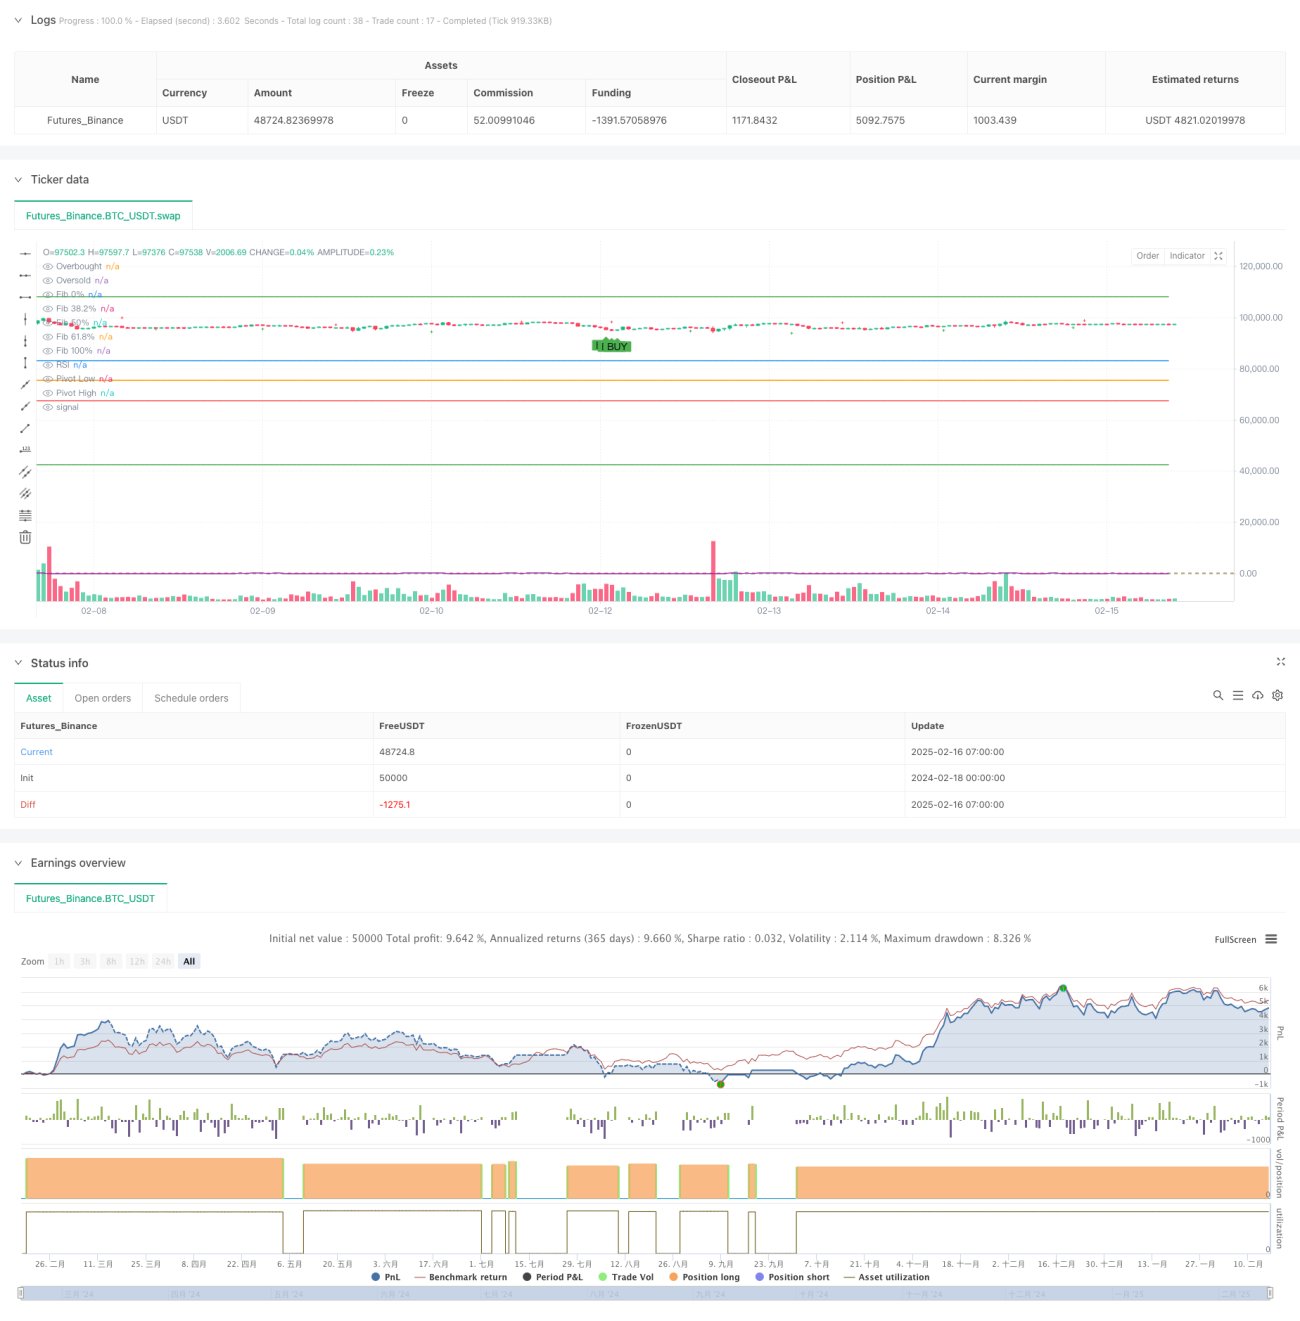
Chiến lược này là một hệ thống giao dịch đa chiều kết hợp Fibonacci retracement, điểm trung tâm và chỉ số tương đối yếu ((RSI)). Nó nắm bắt các cơ hội giao dịch tiềm năng bằng cách xác định các mức kháng cự hỗ trợ quan trọng và tình trạng bán tháo thị trường. Chiến lược này sử dụng phương pháp xác minh chéo của nhiều chỉ số kỹ thuật để tăng độ tin cậy của tín hiệu giao dịch.
Nguyên tắc chiến lược
Lập luận cốt lõi của chiến lược dựa trên sự phối hợp của ba thành phần quan trọng:
- Đường Fibonacci ((38.2%, 50%, 61.8%) được sử dụng để xác định các vùng kháng cự hỗ trợ tiềm năng, các mức này được tính toán tự động bằng các điểm cao và thấp.
- Hệ thống điểm mấu chốt thông qua cửa sổ thời gian 14 chu kỳ để xác định cao điểm và thấp điểm của dải sóng, giúp xác định cấu trúc thị trường.
- Chỉ số RSI sử dụng thiết lập 14 chu kỳ để xác định các điều kiện quá mua (<70) và quá bán (<30).
Điều kiện kích hoạt tín hiệu giao dịch:
- Dấu hiệu mua: Giá tăng trở lại từ Fibonacci và RSI nằm trong khu vực bán tháo
- Tín hiệu bán: Giá giảm từ Fibonacci và RSI ở vùng quá mua
Lợi thế chiến lược
- Phân tích đa chiều làm tăng độ chính xác của giao dịch, giảm tín hiệu giả mạo thông qua xác minh chéo của các chỉ số kỹ thuật.
- Khả năng thích ứng mạnh mẽ, chiến lược có thể tự động điều chỉnh mức kháng cự hỗ trợ theo biến động của thị trường.
- Quản lý rủi ro hoàn hảo, kiểm soát lỗ hổng rủi ro cho mỗi giao dịch thông qua quản lý tiền phần trăm.
- Hình ảnh rất tốt, người giao dịch có thể hiểu trực quan cấu trúc thị trường và tín hiệu giao dịch.
Rủi ro chiến lược
- Trong một thị trường biến động mạnh mẽ, sự hỗ trợ của kháng cự có thể giảm hiệu quả.
- Nhiều chỉ số có thể gây ra sự chậm trễ tín hiệu, ảnh hưởng đến thời gian nhập cảnh.
- Trong thời gian xu hướng mạnh, chiến lược đảo ngược có thể không hoạt động tốt.
Đề xuất kiểm soát rủi ro:
- Thiết lập mức dừng thích hợp để tránh thiệt hại lớn
- Cẩn thận giao dịch trong thời gian công bố dữ liệu kinh tế quan trọng
- Phân tích xu hướng kết hợp với khoảng thời gian lớn hơn
Hướng tối ưu hóa chiến lược
-
Tối ưu hóa tham số chỉ báo:
- Cân nhắc điều chỉnh chu kỳ và mức giảm của RSI để phù hợp với các môi trường thị trường khác nhau
- Tối ưu hóa chu kỳ tính toán của các điểm trung tâm, nâng cao độ chính xác của nhận diện điểm chuyển hướng
-
Lọc tín hiệu:
- Thêm xác nhận giao dịch
- Tiếp theo, bạn có thể sử dụng một bộ lọc xu hướng để tránh sự đảo ngược trong một xu hướng mạnh.
-
Quản lý rủi ro tốt:
- Thực hiện cơ chế dừng lỗ động
- Định lượng vị trí tùy theo biến động
Tóm tắt
Đây là một hệ thống giao dịch hoàn chỉnh dựa trên nhiều chỉ số kỹ thuật để nắm bắt cơ hội đảo ngược thị trường bằng cách hỗ trợ các chỉ số kháng cự và động lực. Ưu điểm của chiến lược là phương pháp phân tích đa chiều và cơ chế quản lý rủi ro hoàn thiện, nhưng người sử dụng cần chú ý đến ảnh hưởng của môi trường thị trường đối với hiệu suất chiến lược và tối ưu hóa tham số dựa trên tình hình thực tế.
/*backtest
start: 2024-02-18 00:00:00
end: 2025-02-16 08:00:00
period: 1h
basePeriod: 1h
exchanges: [{"eid":"Futures_Binance","currency":"BTC_USDT"}]
*/

//@version=5
strategy("Fibonacci Retracement + Pivot Points + RSI Strategy", overlay=true, default_qty_type=strategy.percent_of_equity, default_qty_value=20)

// --- Fibonacci Retracement Parameters ---- 1