Tổng quan
Chiến lược này là một hệ thống giao dịch tự động kết hợp các chỉ số trung bình di chuyển (EMA) và các chỉ số tương đối mạnh (RSI). Nó xác định hướng xu hướng thông qua các đường giao dịch nhanh và chậm của EMA, đồng thời sử dụng RSI làm chỉ số xác nhận xu hướng, cũng bao gồm cơ chế quản lý tiền và kiểm soát rủi ro hoàn chỉnh.
Nguyên tắc chiến lược
Logic cốt lõi của chiến lược này dựa trên các yếu tố chính sau:
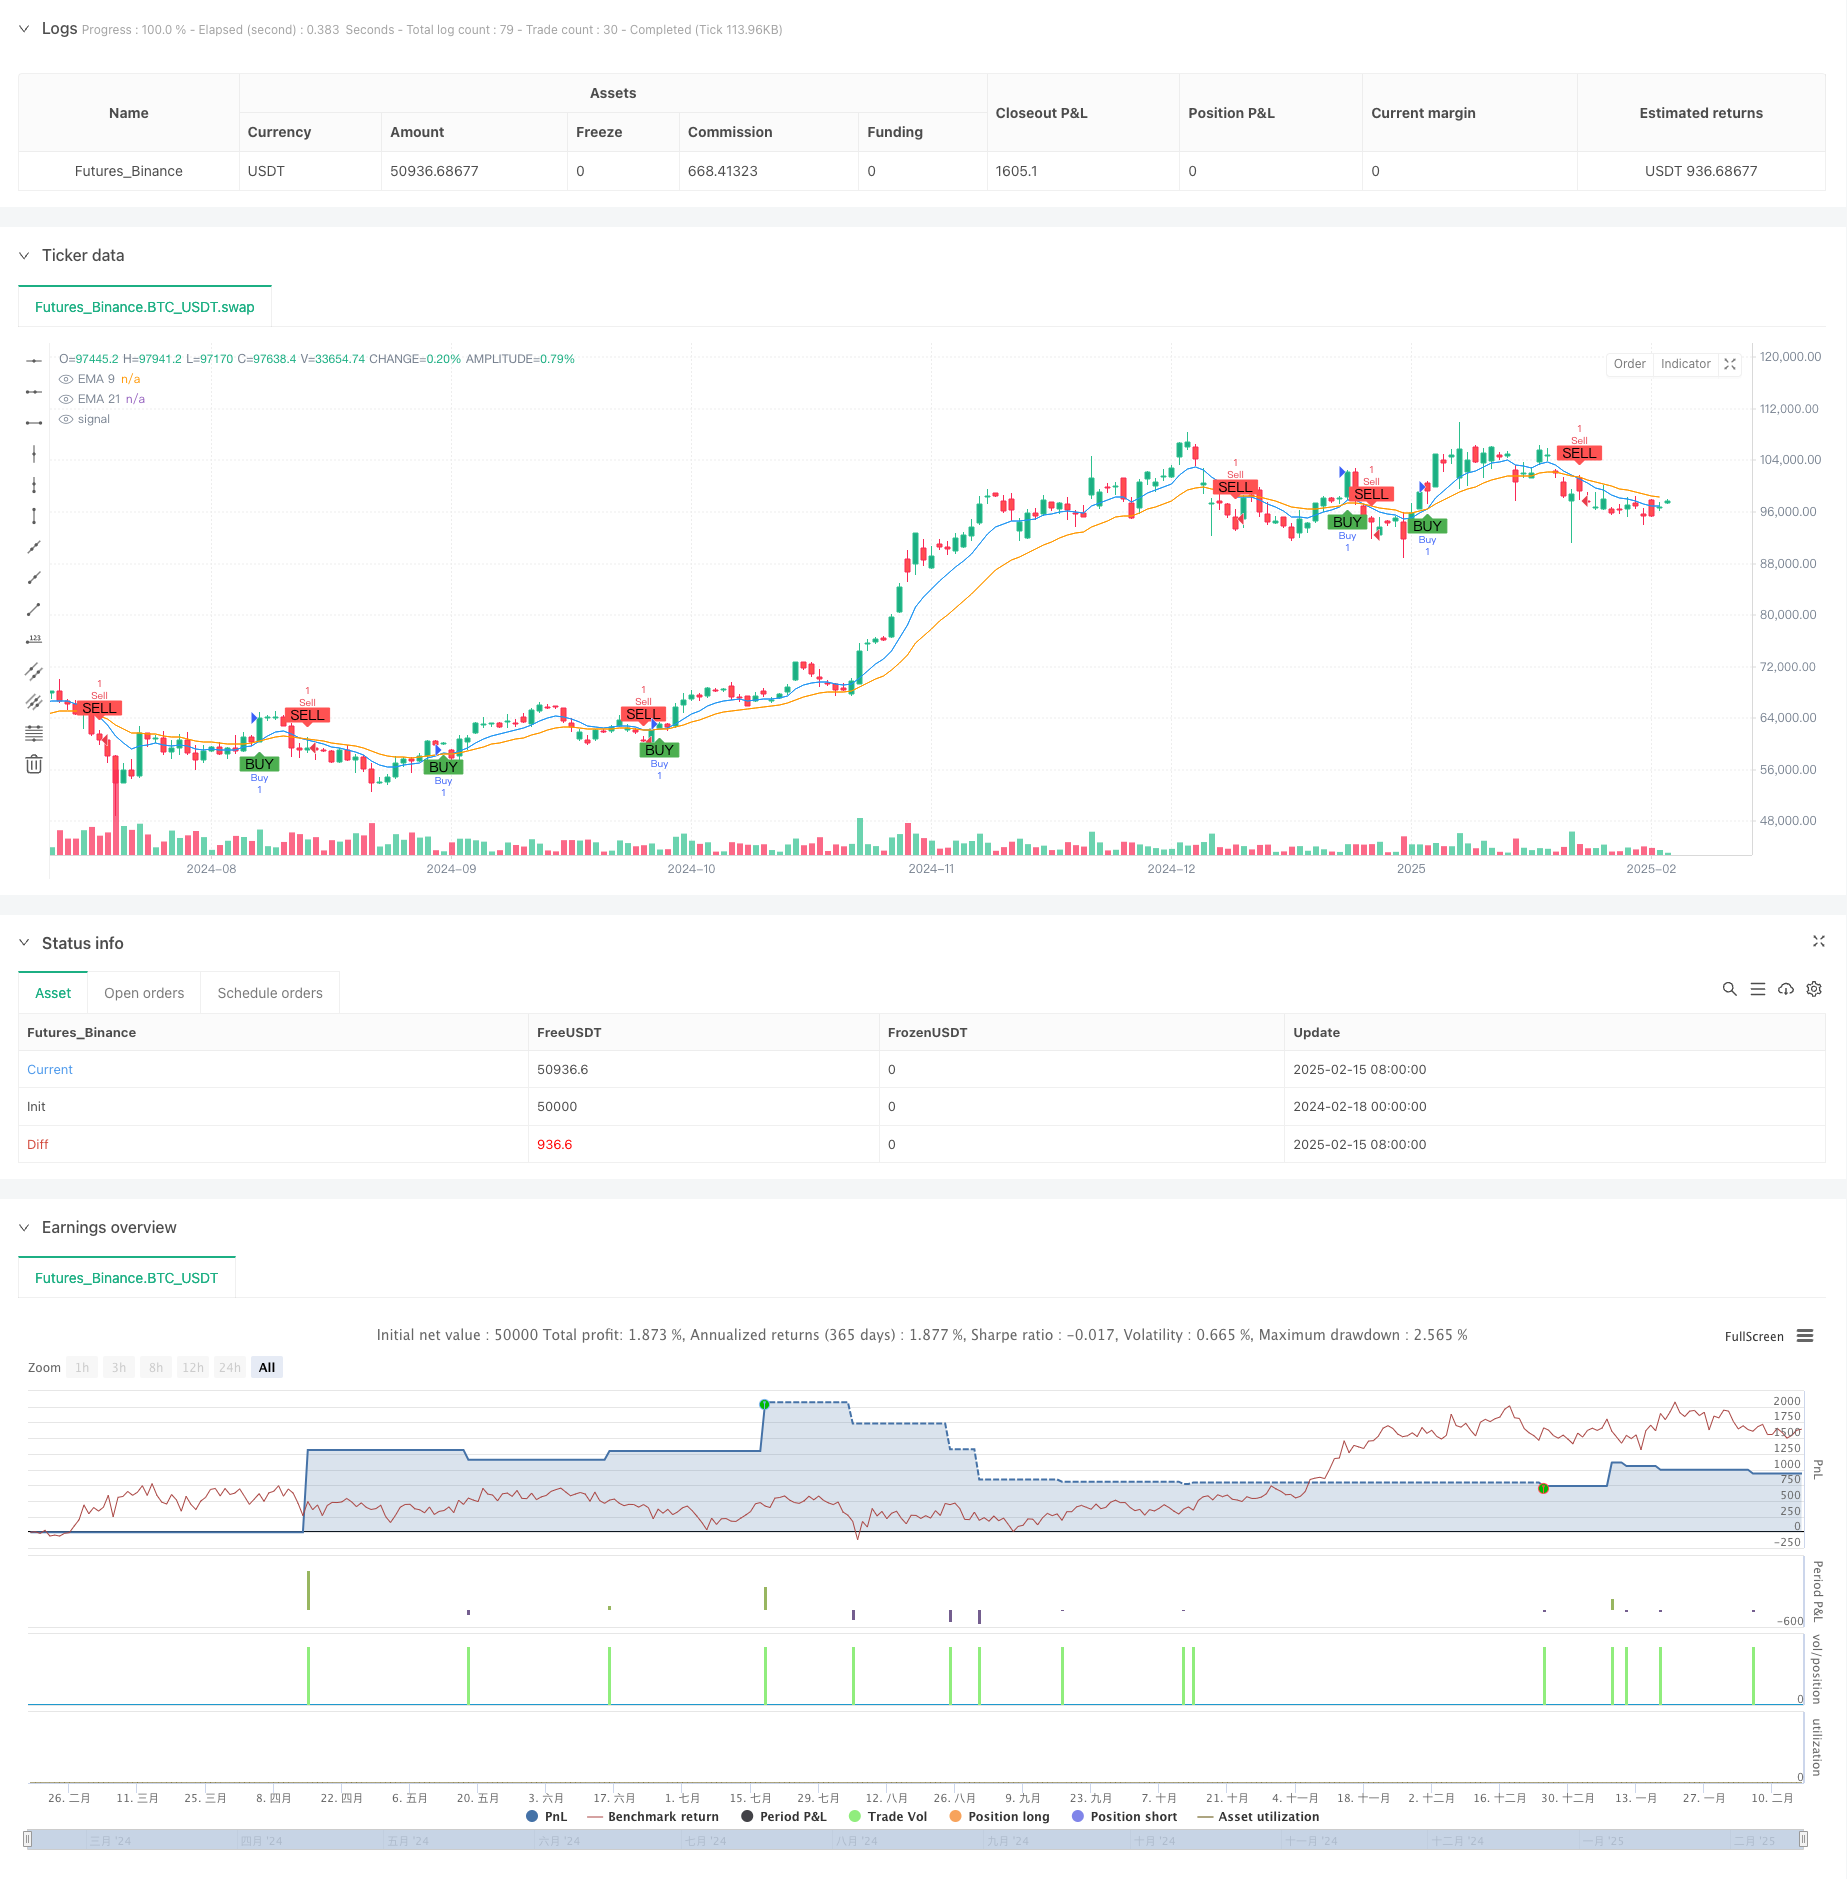
- Sử dụng EMA 9 chu kỳ và 21 chu kỳ để xác định điểm biến xu hướng, một đường đi trên đường nhanh đại diện cho sự bắt đầu của xu hướng tăng, một đường đi dưới đại diện cho sự bắt đầu của xu hướng giảm
- Chỉ số RSI là một công cụ xác nhận xu hướng, yêu cầu RSI> 50 khi có tín hiệu mua và yêu cầu RSI < 50 khi có tín hiệu bán
- Hệ thống quản lý rủi ro đặt mức lỗ tối đa cho mỗi giao dịch là 1000, mục tiêu lợi nhuận là 5000, đạt được tỷ lệ lợi nhuận rủi ro cố định bằng cách điều chỉnh quy mô nắm giữ
- Hệ thống sử dụng thiết lập dừng lỗ với số điểm cố định (25 điểm) và tính toán số lần mở vị trí dựa trên số tiền rủi ro động
- Cơ chế phát hiện thất bại giao dịch có thể phát hiện các giao dịch dừng lỗ và đánh dấu các điểm thất bại trên biểu đồ
Lợi thế chiến lược
- Cơ chế xác minh kép kết hợp theo dõi xu hướng và xác nhận động lực nâng cao độ tin cậy của tín hiệu giao dịch
- Hệ thống quản lý tài chính tốt, rủi ro cho mỗi giao dịch được cố định, tránh mất mát quá mức
- Cài đặt tỷ lệ lợi nhuận/nguy cơ rõ ràng 1: 5), thuận lợi cho lợi nhuận dài hạn
- Hệ thống có khả năng thực hiện giao dịch tự động, giảm sự can thiệp của con người
- Hình ảnh đánh dấu các giao dịch thất bại giúp tối ưu hóa chiến lược và phân tích phản hồi
Rủi ro chiến lược
- Chiến lược giao chéo của EMA có thể tạo ra các tín hiệu sai thường xuyên trong thị trường lắc lư
- Lệnh dừng số điểm cố định có thể không đủ linh hoạt và khó thích ứng với sự thay đổi biến động
- Tỷ lệ rủi ro/lợi nhuận lớn hơn 1: 5 có thể làm giảm tỷ lệ thắng
- Chỉ số RSI có thể không hiệu quả trong điều kiện thị trường cực đoan
- Số lượng giao dịch cố định có thể không phù hợp với mọi điều kiện thị trường
Hướng tối ưu hóa chiến lược
- Tiến hành các cơ chế dừng tự điều chỉnh như dừng động dựa trên ATR
- Thêm bộ lọc biến động thị trường, điều chỉnh các tham số chiến lược trong thời gian biến động cao
- Xem xét thêm các chỉ số giao dịch như một công cụ xác nhận phụ trợ
- Phát triển cơ chế điều chỉnh đồng hồ động, thích nghi với tình hình thị trường
- Thêm nhiều công cụ xác định xu hướng như MACD hoặc Blink
Tóm tắt
Chiến lược này xây dựng một hệ thống giao dịch hoàn chỉnh bằng cách kết hợp các chỉ số EMA và RSI, bao gồm các liên kết quan trọng như tạo tín hiệu, quản lý rủi ro và thực hiện giao dịch. Mặc dù có một số nơi cần được tối ưu hóa, nhưng thiết kế khung tổng thể là hợp lý, đặc biệt là các cân nhắc về quản lý tài chính. Bằng cách tối ưu hóa và hoàn thiện hơn nữa, chiến lược này có khả năng hoạt động tốt hơn trong giao dịch thực tế.
/*backtest
start: 2024-02-18 00:00:00
end: 2025-02-16 08:00:00
period: 1d
basePeriod: 1d
exchanges: [{"eid":"Futures_Binance","currency":"BTC_USDT"}]
*/

// This Pine Script™ code is subject to the terms of the Mozilla Public License 2.0 at https://mozilla.org/MPL/2.0/
// © Lukhi24

//@version=6
strategy("Lukhi EMA Crossover_TWL Strategy" , overlay=true)

// Input Parameters
capital = 15000  // Capital: ₹15,000
risk_per_trade = 1000  // Risk per Trade: ₹1,000
target_per_trade = 5000  // Take Profit per Trade: ₹5,000
lot_size = input.int(1, title="Lot Size")  // Nifty option lot size (adjust as per your instrument)
stop_loss_distance = input.float(25, title="Stop Loss Distance (Points)")  // Fixed stop-loss in points (adjustable)

// EMA Parameters
short_ema_length = input.int(9, title="Short EMA Length")
long_ema_length = input.int(21, title="Long EMA Length")

// RSI Parameters
rsi_length = input.int(14, title="RSI Length")
rsi_overbought = input.float(70, title="RSI Overbought Level")
rsi_oversold = input.float(30, title="RSI Oversold Level")

// Calculations
ema_short = ta.ema(close, short_ema_length)
ema_long = ta.ema(close, long_ema_length)
rsi = ta.rsi(close, rsi_length)

// Buy and Sell Signals
buy_signal = ta.crossover(ema_short, ema_long) and rsi > 50
sell_signal = ta.crossunder(ema_short, ema_long) and rsi < 50

// Plot EMAs on the chart
plot(ema_short, color=color.blue, title="EMA 9")
plot(ema_long, color=color.orange, title="EMA 21")

// Risk Management: Position size based on stop-loss distance
position_size = risk_per_trade / stop_loss_distance

// Stop Loss and Take Profit Levels
long_stop_loss = close - stop_loss_distance
long_take_profit = close + (target_per_trade / position_size)

short_stop_loss = close + stop_loss_distance
short_take_profit = close - (target_per_trade / position_size)

// Strategy Logic: Entry, Stop Loss, and Take Profit
if (buy_signal)
    strategy.entry("Buy", strategy.long, qty=lot_size)
    strategy.exit("Exit Buy", "Buy", stop=long_stop_loss, limit=long_take_profit)

if (sell_signal)
    strategy.entry("Sell", strategy.short, qty=lot_size)
    strategy.exit("Exit Sell", "Sell", stop=short_stop_loss, limit=short_take_profit)

// Track Trade Result and Detect Failures
long_trade_loss = strategy.position_size > 0 and close <= long_stop_loss
short_trade_loss = strategy.position_size < 0 and close >= short_stop_loss

// Plot Buy and Sell signals on the chart
plotshape(buy_signal, location=location.belowbar, color=color.green, style=shape.labelup, title="Buy Signal", text="BUY")
plotshape(sell_signal, location=location.abovebar, color=color.red, style=shape.labeldown, title="Sell Signal", text="SELL")

// Plot Failure Signals
plotshape(long_trade_loss, location=location.belowbar, color=color.red, style=shape.cross, title="Long Trade Failed", text="Failed")
plotshape(short_trade_loss, location=location.abovebar, color=color.red, style=shape.cross, title="Short Trade Failed", text="Failed")