Kênh hồi quy tuyến tính động và chiến lược giao dịch tối ưu hóa thoát Heinz

LR HA TP/SL VOL STD
Ngày tạo: 2025-02-18 15:18:08 sửa đổi lần cuối: 2025-02-18 15:18:08
sao chép: 2 Số nhấp chuột: 374
1
tập trung vào
1617
Người theo dõi

Kênh hồi quy tuyến tính động và chiến lược giao dịch tối ưu hóa thoát Heinz

Chiến lược này là một hệ thống giao dịch định lượng dựa trên các kênh quay trở tuyến tính và biểu đồ Heineken, kết hợp với cơ chế dừng lỗ động, đặc biệt để nắm bắt cơ hội biến động nhanh chóng trong thị trường.

Tổng quan về chiến lược

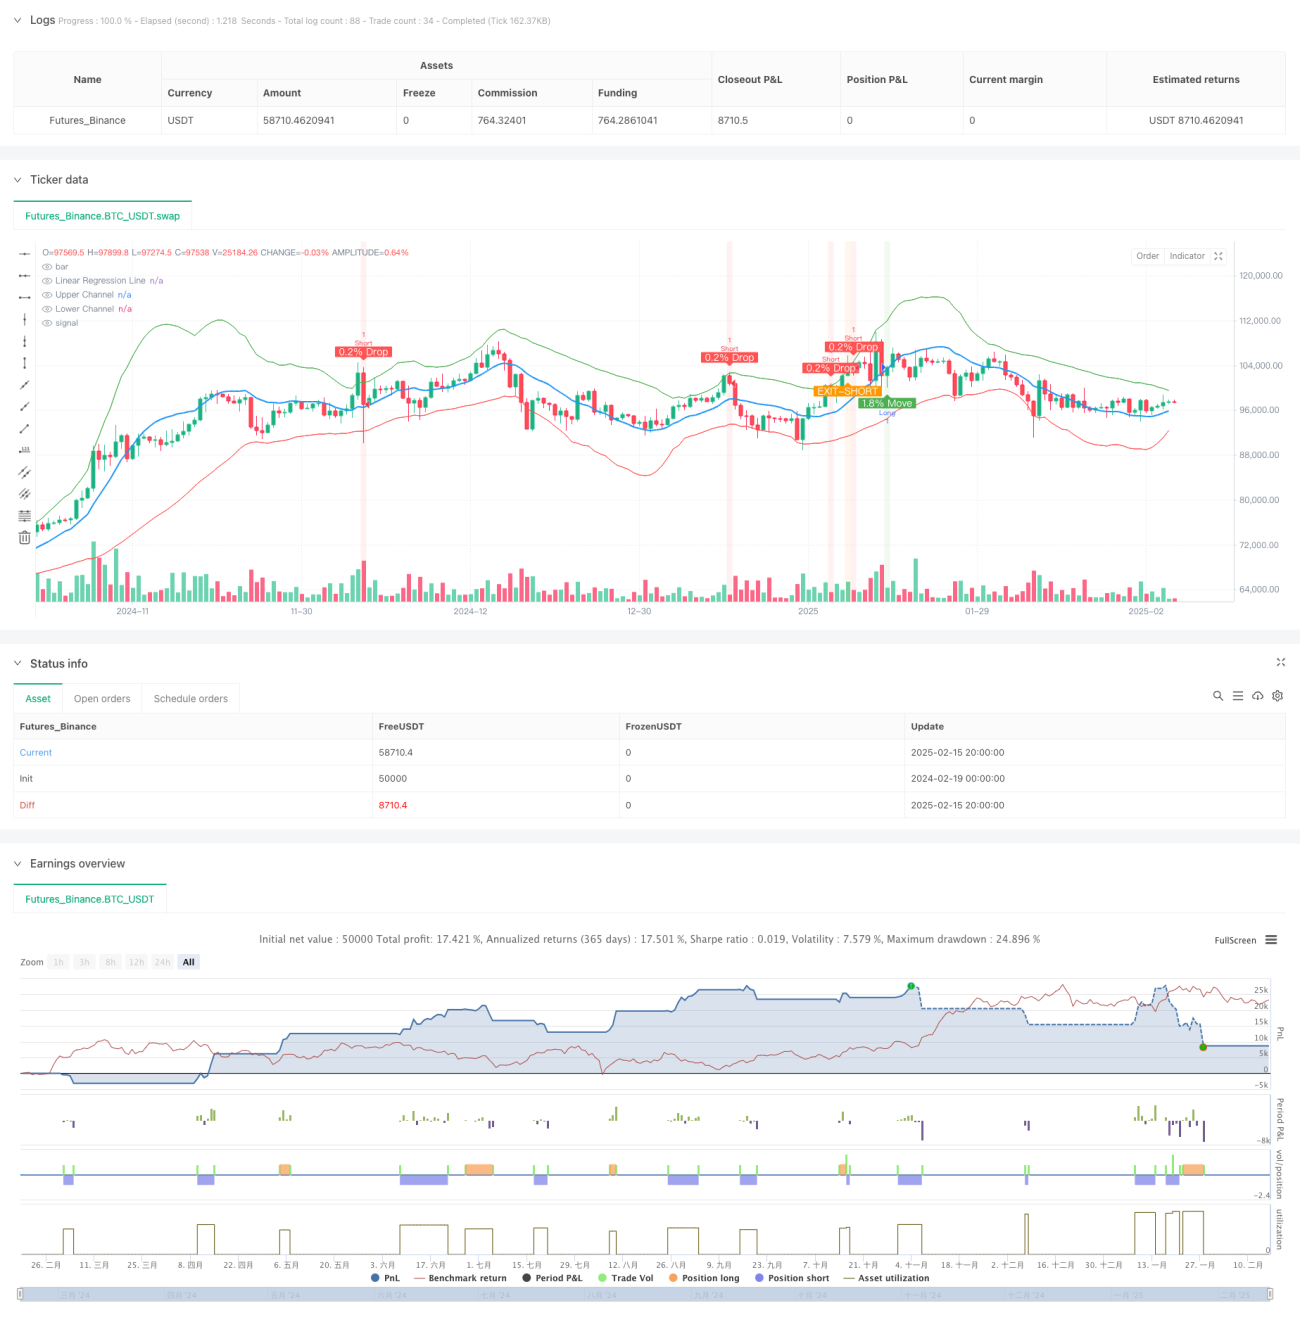
Chiến lược này sử dụng kênh quay ngược tuyến tính như một khung giao dịch chính để xác định cơ hội giao dịch tiềm năng bằng cách theo dõi chuyển động của giá trong kênh. Hệ thống sẽ phát ra nhiều tín hiệu khi giá phá vỡ đường dẫn xuống và tăng hơn 1,8%; hệ thống sẽ phát ra một dấu hiệu trống khi giá phá vỡ đường dẫn lên và giảm hơn 0,2%.

Nguyên tắc chiến lược

Cốt lõi của chiến lược là tính toán hồi quy tuyến tính dựa trên 30 chu kỳ, thiết lập chiều rộng kênh bằng 2 lần chênh lệch tiêu chuẩn. Các tín hiệu vào dựa trên các điều kiện sau:

  1. Nhiều đầu vào yêu cầu giá tăng hơn 1.8% sau khi phá vỡ đường xuống và không tăng hơn 5% trong 2 giờ
  2. Thêm 0.2% giảm sau khi giá phá vỡ đường ray
  3. Bản đồ Heinrich sử dụng khung thời gian 3 phút để xác định thời gian ra sân
  4. 10% Stop Loss và 5% Stop Loss để kiểm soát rủi ro

Lợi thế chiến lược

  1. Kết hợp các tính năng của xu hướng và giao dịch đảo ngược để nắm bắt cơ hội thị trường nhanh chóng
  2. Sử dụng bản đồ Heinrichs như một chỉ số ra sân, cung cấp một cơ chế ra sân mạnh hơn
  3. Có các biện pháp kiểm soát rủi ro rõ ràng, bao gồm cài đặt dừng lỗ
  4. Bộ lọc tiếng ồn thị trường thông qua kênh hồi quy tuyến tính để cải thiện chất lượng tín hiệu
  5. Các nhà đầu tư cũng có thể sử dụng các biện pháp khác để giảm giá cả.

Rủi ro chiến lược

  1. Có thể thường xuyên kích hoạt dừng lỗ trong thị trường biến động cao
  2. Thị trường có thể phản ứng chậm với sự thay đổi nhanh chóng
  3. Tỷ lệ Stop Loss cố định có thể không phù hợp với tất cả các điều kiện thị trường
  4. Có thể có quá nhiều tín hiệu giả trong thị trường ngang
  5. Cần tính toán dữ liệu trực tiếp, có yêu cầu về tốc độ thực hiện

Hướng tối ưu hóa chiến lược

  1. Đề xuất điều chỉnh tỷ lệ dừng lỗ theo biến động của thị trường
  2. Có thể thêm chỉ số giao dịch để xác nhận tín hiệu
  3. Xem xét giới thiệu chu kỳ hồi quy tuyến tính thích ứng
  4. Tối ưu hóa điều kiện ra sân của Hynes, có thể cần thêm các chỉ số xác nhận
  5. Khuyến nghị thêm bộ lọc thời gian giao dịch để tránh giao dịch trong thời gian thiếu thanh khoản

Tóm tắt

Chiến lược này cung cấp cho các nhà giao dịch một hệ thống giao dịch tương đối hoàn chỉnh bằng cách kết hợp các kênh hồi phục tuyến tính và đột phá giá. Ưu điểm của nó là kết hợp nhiều chỉ số kỹ thuật và các biện pháp kiểm soát rủi ro, nhưng vẫn cần phải được tối ưu hóa và điều chỉnh theo tình hình thị trường thực tế.

Mã nguồn chiến lược
/*backtest
start: 2024-02-19 00:00:00
end: 2025-02-16 08:00:00
period: 12h
basePeriod: 12h
exchanges: [{"eid":"Futures_Binance","currency":"BTC_USDT"}]
*/

//@version=6
strategy('STRATEGY WITH SL', overlay=true)

// Parameters for Linear Regression
length = input.int(30, title='Linear Regression Length')  
mult = input.float(2.0, title='Channel Multiplier', step=0.1)  

// Calculate Linear Regression
regression_line = ta.linreg(close, length, 0)

// Calculate Standard Deviation
stddev = ta.stdev(close, length)

// Upper and Lower Channel Boundaries
upper_channel = regression_line + mult * stddev
lower_channel = regression_line - mult * stddev

// Plot the Linear Regression and Channel
plot(regression_line, color=color.blue, linewidth=2, title='Linear Regression Line')
plot(upper_channel, color=color.green, linewidth=1, title='Upper Channel')
plot(lower_channel, color=color.red, linewidth=1, title='Lower Channel')

// Parameters for Price Move Check (Indicator 1: 1.8% Move)
threshold_move = 1.8 
large_threshold_move = 5.0  
timeframe_for_large_move = 120  

// Calculate the percentage change over the last 3 minutes
priceChange = (close - close[3]) / close[3] * 100

// Calculate the percentage change over the last 2 hours (120 minutes)
priceChange2Hour = (close - close[120]) / close[120] * 100

// Condition for a price move greater than 1.8%
isPriceUp = priceChange > threshold_move

// Condition for price move greater than 5% in 2 hours (no alert if true)
isLargePriceMove = priceChange2Hour > large_threshold_move

// Parameters for Price Drop Check (Indicator 2: 0.2% Drop)
threshold_drop = 0.2 / 100  // 0.2% threshold

// Get the price 3 minutes ago
price_3min_ago = request.security(syminfo.tickerid, '3', close[1])

// Calculate the percentage drop over the last 3 minutes
price_drop = (close - price_3min_ago) / price_3min_ago

// Condition for a 0.2% drop
drop_condition = price_drop <= -threshold_drop

// Track whether the price has crossed the upper or lower Linear Regression channel
var bool lower_crossed = false
var bool upper_crossed = false
var bool move_after_cross = false  
var bool alert_sent = false

// Reset flags when price crosses channels
if (close < lower_channel)
    lower_crossed := true
    move_after_cross := false

if (close > upper_channel)
    upper_crossed := true
    alert_sent := false  

// Combine both conditions for price crossing lower and upper channels and move/drop conditions
final_condition_long = lower_crossed and isPriceUp and not move_after_cross and not isLargePriceMove
final_condition_short = upper_crossed and drop_condition and not alert_sent

// Set flags when conditions are met
if (final_condition_long)
    move_after_cross := true

if (final_condition_short)
    alert_sent := true

// Heikin-Ashi calculation for dynamic timeframe (3-minute)
heikin_open = (open + close) / 2
heikin_close = (open + high + low + close) / 4
heikin_high = math.max(high, math.max(heikin_open, heikin_close))
heikin_low = math.min(low, math.min(heikin_open, heikin_close))

// Conditions for EXIT signals based on Heikin-Ashi candle body
exit_long_condition = (heikin_open > lower_channel and heikin_close < lower_channel) or (heikin_open < lower_channel and heikin_close > lower_channel)
exit_short_condition = heikin_open < upper_channel and heikin_close > upper_channel

// Strategy logic: Enter long or short based on the combined conditions

// Long Entry Condition
if (final_condition_long)
    strategy.entry('Long', strategy.long)

// Short Entry Condition
if (final_condition_short)
    strategy.entry('Short', strategy.short)

// Exit Conditions (EXIT-LONG and EXIT-SHORT)
if (exit_long_condition)
    strategy.close('Long')

if (exit_short_condition)
    strategy.close('Short')

// Take Profit and Stop Loss
take_profit = 10 / 100  // 10% Take Profit
stop_loss = 5 / 100    // 5% Stop Loss

// Calculate Take Profit and Stop Loss levels based on entry price
long_take_profit = strategy.position_avg_price * (1 + take_profit)
long_stop_loss = strategy.position_avg_price * (1 - stop_loss)

short_take_profit = strategy.position_avg_price * (1 - take_profit)
short_stop_loss = strategy.position_avg_price * (1 + stop_loss)

// Apply Take Profit and Stop Loss for Long and Short positions
strategy.exit('Take Profit/Stop Loss Long', from_entry='Long', limit=long_take_profit, stop=long_stop_loss)
strategy.exit('Take Profit/Stop Loss Short', from_entry='Short', limit=short_take_profit, stop=short_stop_loss)

// Plot background color when the conditions are met (for visual aid)
bgcolor(final_condition_long ? color.new(color.green, 90) : na, title='Price Move Alert After Lower Channel Crossed')
bgcolor(final_condition_short ? color.new(color.red, 90) : na, title='Price Drop Alert After Upper Channel Crossed')
bgcolor(exit_long_condition ? color.new(color.blue, 90) : na, title='EXIT-LONG Alert')
bgcolor(exit_short_condition ? color.new(color.orange, 90) : na, title='EXIT-SHORT Alert')

// Plot shapes when conditions are met
plotshape(final_condition_long, style=shape.labelup, location=location.belowbar, color=color.green, text='1.8% Move', textcolor=color.white, size=size.small)
plotshape(final_condition_short, style=shape.labeldown, location=location.abovebar, color=color.red, text='0.2% Drop', textcolor=color.white, size=size.small)
plotshape(exit_long_condition, style=shape.labeldown, location=location.abovebar, color=color.purple, text='EXIT-LONG', textcolor=color.white, size=size.small)
plotshape(exit_short_condition, style=shape.labelup, location=location.belowbar, color=color.orange, text='EXIT-SHORT', textcolor=color.white, size=size.small)

// Alert conditions for price moves and exits
alertcondition(final_condition_long, title="Price Move > 1.8% After Lower LR Channel Cross", message="Price crossed the lower Linear Regression Channel and moved more than 1.8% in the last 3 minutes!")
alertcondition(final_condition_short, title="Price Drop > 0.2% After Upper LR Channel Cross", message="Price crossed the upper Linear Regression Channel and dropped more than 0.2% in the last 3 minutes!")
alertcondition(exit_long_condition, title="EXIT-LONG: Heikin-Ashi Candle Body Crossing Lower LR Channel", message="The body of a 3-minute Heikin-Ashi candle is crossing outside the lower Linear Regression Channel.")
alertcondition(exit_short_condition, title="EXIT-SHORT: Heikin-Ashi Candle Body Crossing Upper LR Channel", message="The body of a 3-minute Heikin-Ashi candle is crossing outside the upper Linear Regression Channel.")