
Tổng quan
Đây là một chiến lược giao dịch đột phá dựa trên hành động giá thuần túy, được thiết kế với tỷ lệ lợi nhuận rủi ro cao 1: 5. Chiến lược này giao dịch bằng cách xác định các mức giá quan trọng và kết hợp các mục tiêu dừng lỗ và lợi nhuận với các cấu trúc thị trường động. Chiến lược này không phụ thuộc vào bất kỳ chỉ số kỹ thuật nào và đưa ra quyết định giao dịch hoàn toàn dựa trên hành động giá trong thời gian thực.
Nguyên tắc chiến lược
Logic cốt lõi của chiến lược bao gồm những phần chính sau:
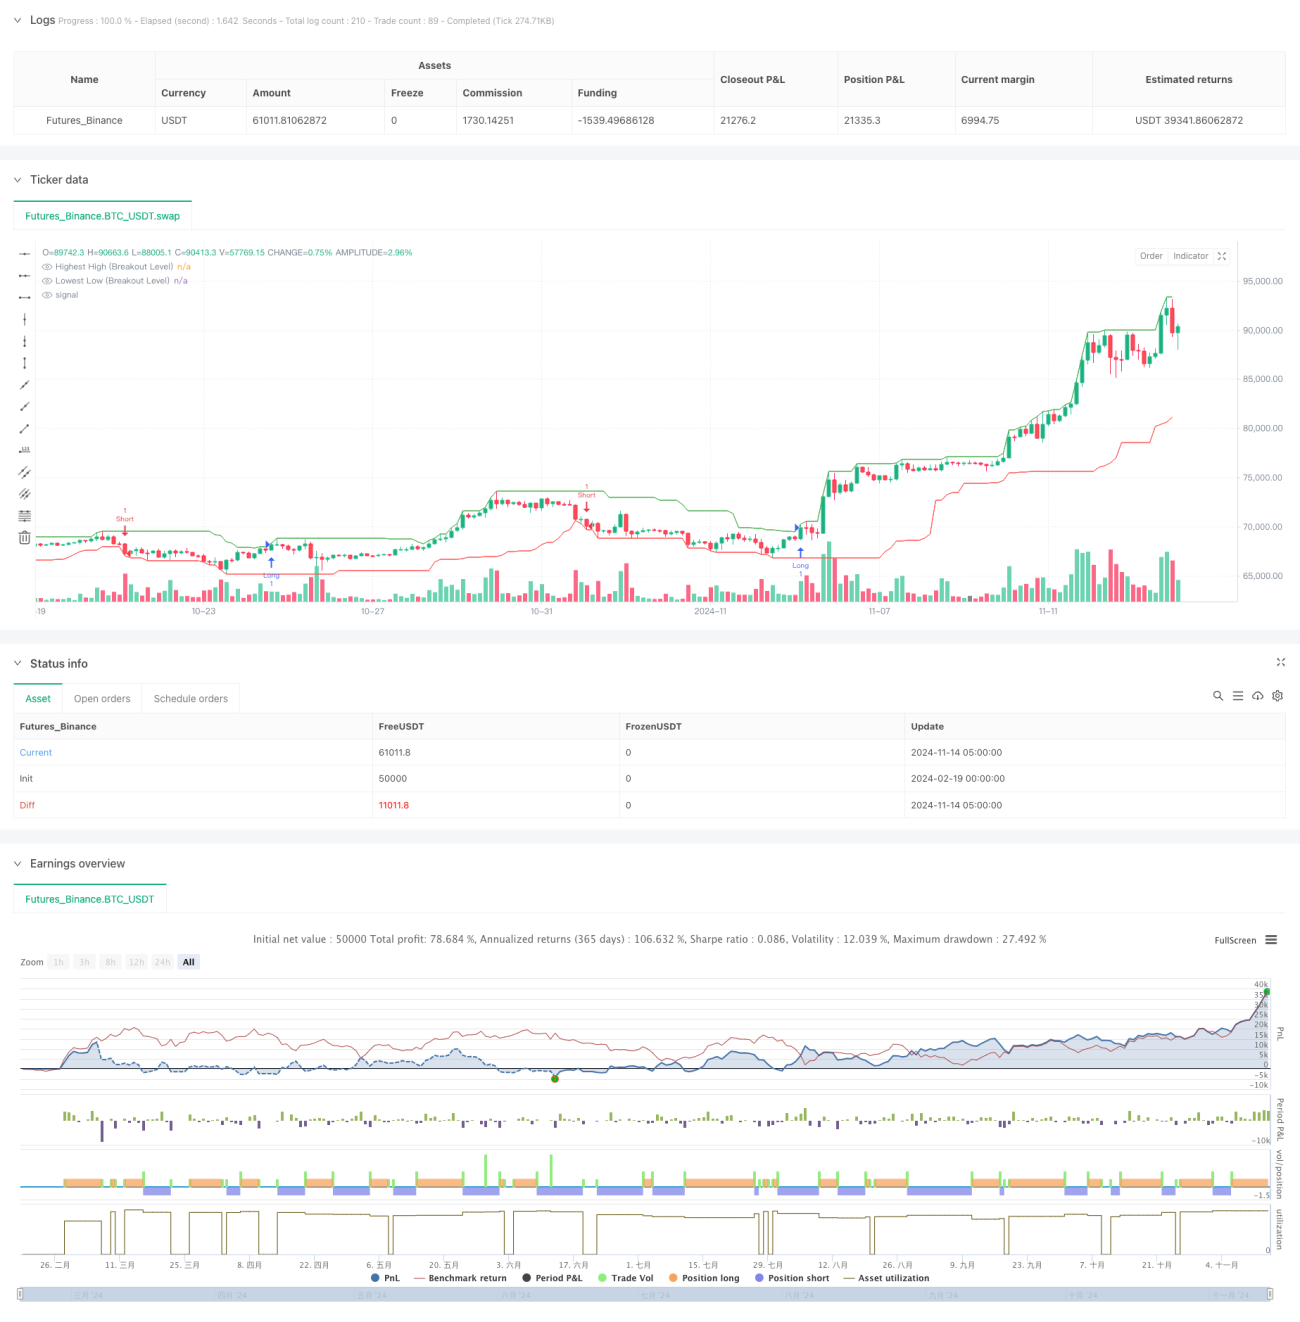
- Xây dựng điểm tham chiếu phá vỡ bằng cách xác định mức giá cao nhất và thấp nhất
- Khởi mở nhiều vị trí khi giá đóng cửa phá vỡ mức cao trước đó, mở vị trí trống khi phá vỡ mức thấp trước đó
- Dựa trên vị trí dừng động của các vị trí biến động gần đây, nhiều vị trí dừng ở điểm thấp, vị trí dừng ở điểm cao
- Xác định vị trí mục tiêu lợi nhuận dựa trên tỷ lệ rủi ro / lợi nhuận 1: 5
- Thiết lập giới hạn giao dịch tối đa mỗi ngày để tránh giao dịch quá mức
Toàn bộ quá trình giao dịch hoàn toàn dựa trên hành vi giá, không sử dụng bất kỳ chỉ số kỹ thuật nào để tham khảo.
Lợi thế chiến lược
- Giao dịch chỉ với giá, tránh sự gián đoạn do chỉ số bị tụt hậu
- Thiết kế với tỷ lệ lợi nhuận cao so với rủi ro, lợi nhuận tiềm năng cho mỗi giao dịch gấp 5 lần rủi ro
- Cài đặt dừng lỗ động, điều chỉnh theo cấu trúc thị trường
- Tín hiệu giao dịch rõ ràng và đánh dấu hình ảnh để thực hiện giao dịch
- Các thông số có thể điều chỉnh cao để thích ứng với các môi trường thị trường khác nhau
- Kiểm soát rủi ro nghiêm ngặt, bao gồm giới hạn số lần giao dịch mỗi ngày
Rủi ro chiến lược
- Các tín hiệu phá vỡ giả có thể xảy ra thường xuyên trong thị trường chấn động
- Tỷ lệ lợi nhuận cao có thể dẫn đến tỷ lệ chiến thắng tương đối thấp
- Gọi lại sau khi phá vỡ có thể gây ra lỗ hổng
- Thay đổi biến động thị trường có thể ảnh hưởng đến hiệu suất chiến lược
- Cần có sự chuyển động giá lớn hơn để đạt được mục tiêu lợi nhuận
Các biện pháp giảm thiểu:
- Sử dụng chiến lược này trong thị trường xu hướng
- Tránh giao dịch trong các thông báo quan trọng
- Cài đặt quy mô vị trí hợp lý
- Kiểm tra thường xuyên và tối ưu hóa tham số
Hướng tối ưu hóa chiến lược
- Thêm bộ lọc xu hướng, chỉ giao dịch theo xu hướng chính
- Thêm cơ chế xác nhận giao dịch, tăng độ tin cậy của đột phá
- Tỷ lệ lợi nhuận rủi ro điều chỉnh theo biến động của tỷ lệ biến động
- Tiến hành phân tích nhiều chu kỳ thời gian để tăng độ chính xác giao dịch
- Phát triển các cơ chế dừng lỗ thông minh hơn, như theo dõi dừng lỗ
- Thêm chức năng nhận diện môi trường thị trường, điều chỉnh tùy chỉnh các tham số chiến lược
Tóm tắt
Đây là một chiến lược giao dịch hành vi giá được thiết kế nghiêm ngặt, logic rõ ràng. Bằng cách thiết kế tỷ lệ lợi nhuận rủi ro cao, theo đuổi lợi nhuận đáng kể trong khi kiểm soát rủi ro hiệu quả. Ưu điểm của chiến lược là chỉ có giá trị, tham số có thể điều chỉnh linh hoạt và kiểm soát rủi ro hoàn hảo. Mặc dù có một số rủi ro phá vỡ giả, nhưng hướng tối ưu hóa được đề xuất có thể nâng cao hơn nữa sự ổn định và độ tin cậy của chiến lược.
- 1