Nhiều chỉ báo chéo theo dõi xu hướng thích ứng động chiến lược giao dịch

1
Follow
1781
Followers
Tổng quan
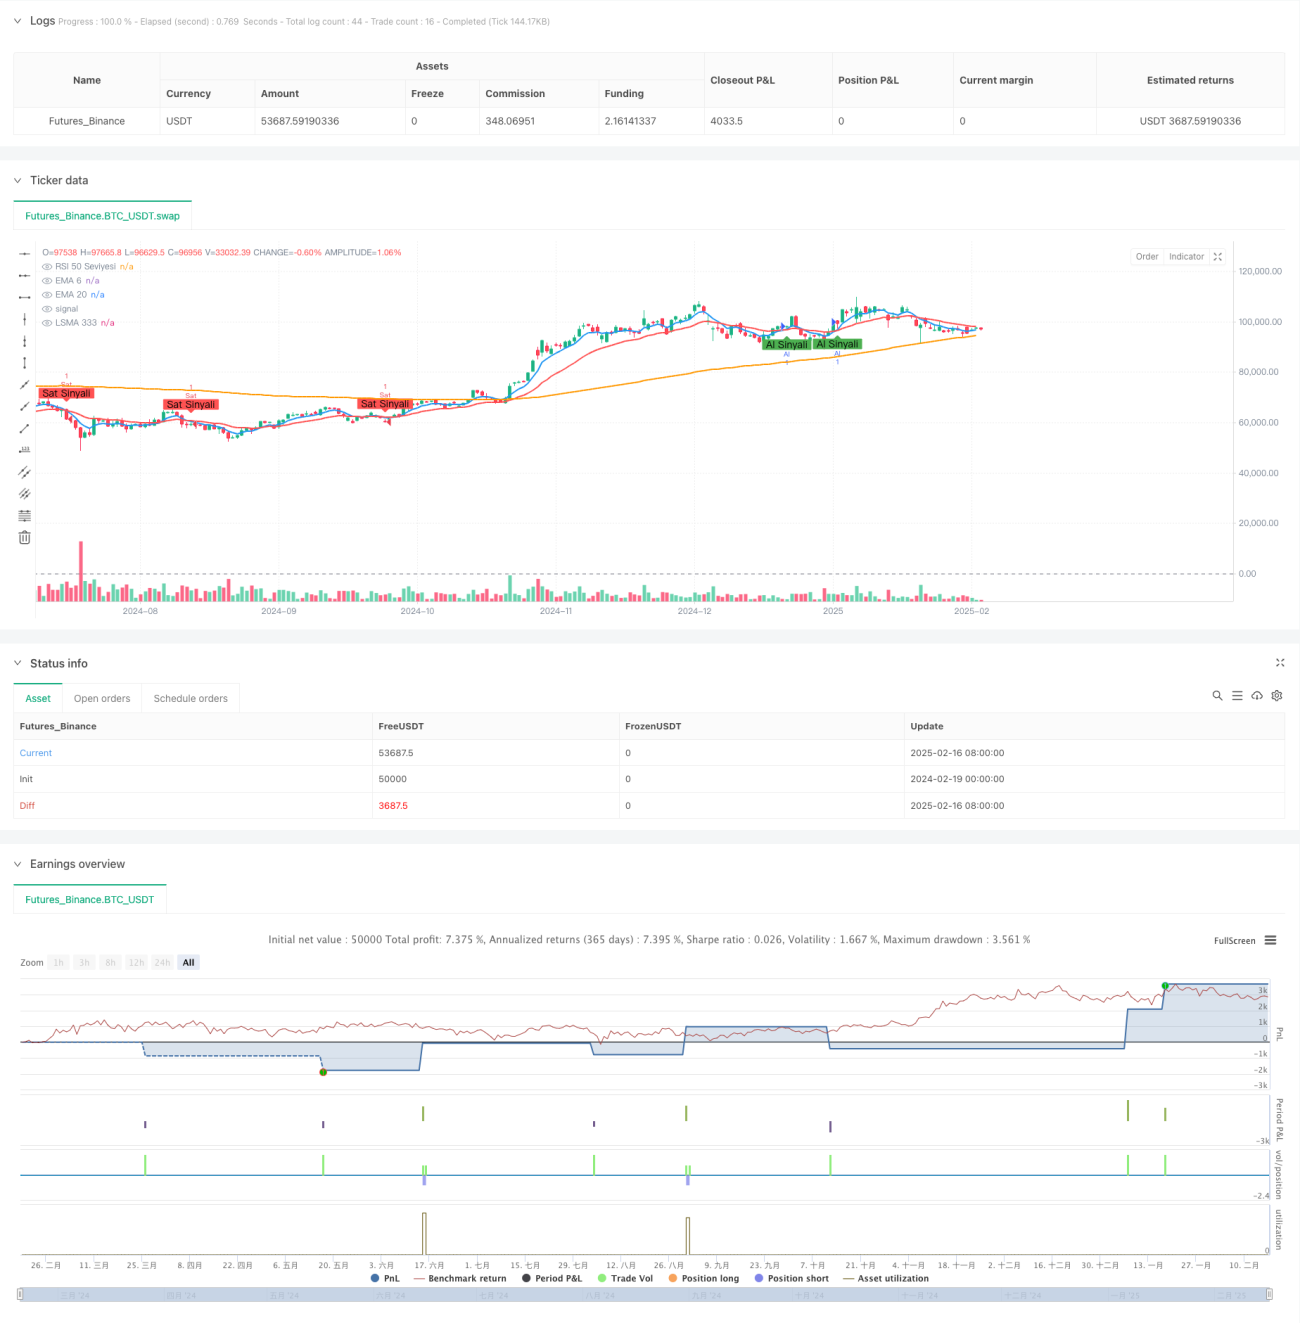
Chiến lược này là một hệ thống theo dõi xu hướng dựa trên sự giao thoa của nhiều chỉ số kỹ thuật, kết hợp ba chỉ số EMA, LSMA và RSI để lọc các cơ hội giao dịch thông qua xác nhận nhiều tín hiệu. Chiến lược này sử dụng cơ chế dừng lỗ thích ứng, có thể điều chỉnh các tham số quản lý rủi ro theo động thái thị trường.
Nguyên tắc chiến lược
Lập luận cốt lõi của chiến lược bao gồm:
- Sử dụng các EMA ngắn kỳ ((6) và dài kỳ ((20) để nắm bắt các điểm biến của xu hướng
- Sử dụng LSMA ((333) như một chỉ số xác nhận xu hướng dài hạn
- Sử dụng đường phân chia 50 của RSI ((14) làm tiêu chuẩn đánh giá thị trường mạnh hoặc yếu
- Trong khi đó, các điều kiện sau đây được đáp ứng khi mở thêm vị thế:
- EMA 6 mặc EMA 20
- Giá trên LSMA333
- RSI lớn hơn 50
- Trong khi đó, các điều kiện sau đây được đáp ứng khi mở kho trống:
- EMA 6 dưới EMA 20
- Giá dưới LSMA333
- RSI nhỏ hơn 50
Lợi thế chiến lược
- Xác nhận đa chỉ số làm giảm đáng kể hiệu ứng của tín hiệu giả
- Kết hợp theo dõi xu hướng và chỉ số động lực, tăng độ tin cậy của tín hiệu
- Sử dụng cơ chế dừng lỗ thích ứng, có thể điều chỉnh linh hoạt theo điều kiện thị trường
- Logic chiến lược rõ ràng và các thông số có thể điều chỉnh cao
- Tăng tỷ lệ thắng giao dịch thông qua phân tích thị trường đa chiều
Rủi ro chiến lược
- Tín hiệu sai thường xuyên có thể xảy ra trong thị trường biến động
- Nhiều chỉ số có thể xác nhận thời điểm nhập cảnh bị chậm lại một chút
- Tỷ lệ dừng lỗ và chốt lời cố định có thể không phù hợp với mọi điều kiện thị trường
- Tối ưu hóa tham số quá mức có thể dẫn đến quá khớp
- Có thể bỏ lỡ một số cơ hội giao dịch trong thời gian nhanh
Hướng tối ưu hóa chiến lược
- Giới thiệu chỉ số biến động để động điều chỉnh tỷ lệ dừng lỗ
- Thêm phân tích khối lượng giao dịch để xác nhận hiệu quả của xu hướng
- Xem xét thêm hệ thống phân loại môi trường thị trường, sử dụng các tham số khác nhau trong các điều kiện thị trường khác nhau
- Cơ chế thích ứng để tối ưu hóa các tham số chỉ số
- Thêm hệ thống quản lý vị trí, kiểm soát vị trí linh hoạt hơn
Tóm tắt
Chiến lược này xây dựng một hệ thống theo dõi xu hướng tương đối vững chắc thông qua việc sử dụng kết hợp nhiều chỉ số kỹ thuật. Điểm mạnh cốt lõi của chiến lược là độ tin cậy của tín hiệu xác nhận, nhưng cũng cần chú ý đến vấn đề thích ứng trong các môi trường thị trường khác nhau. Bằng cách tối ưu hóa và cải tiến liên tục, chiến lược có khả năng hoạt động tốt hơn trong giao dịch thực tế.
Source
Pine
Strategy parameters
Comment
All comments (0)
No data
- 1