Đánh giá xu hướng trung bình động đa kỳ và chiến lược mua quá mức RSI

Tổng quan
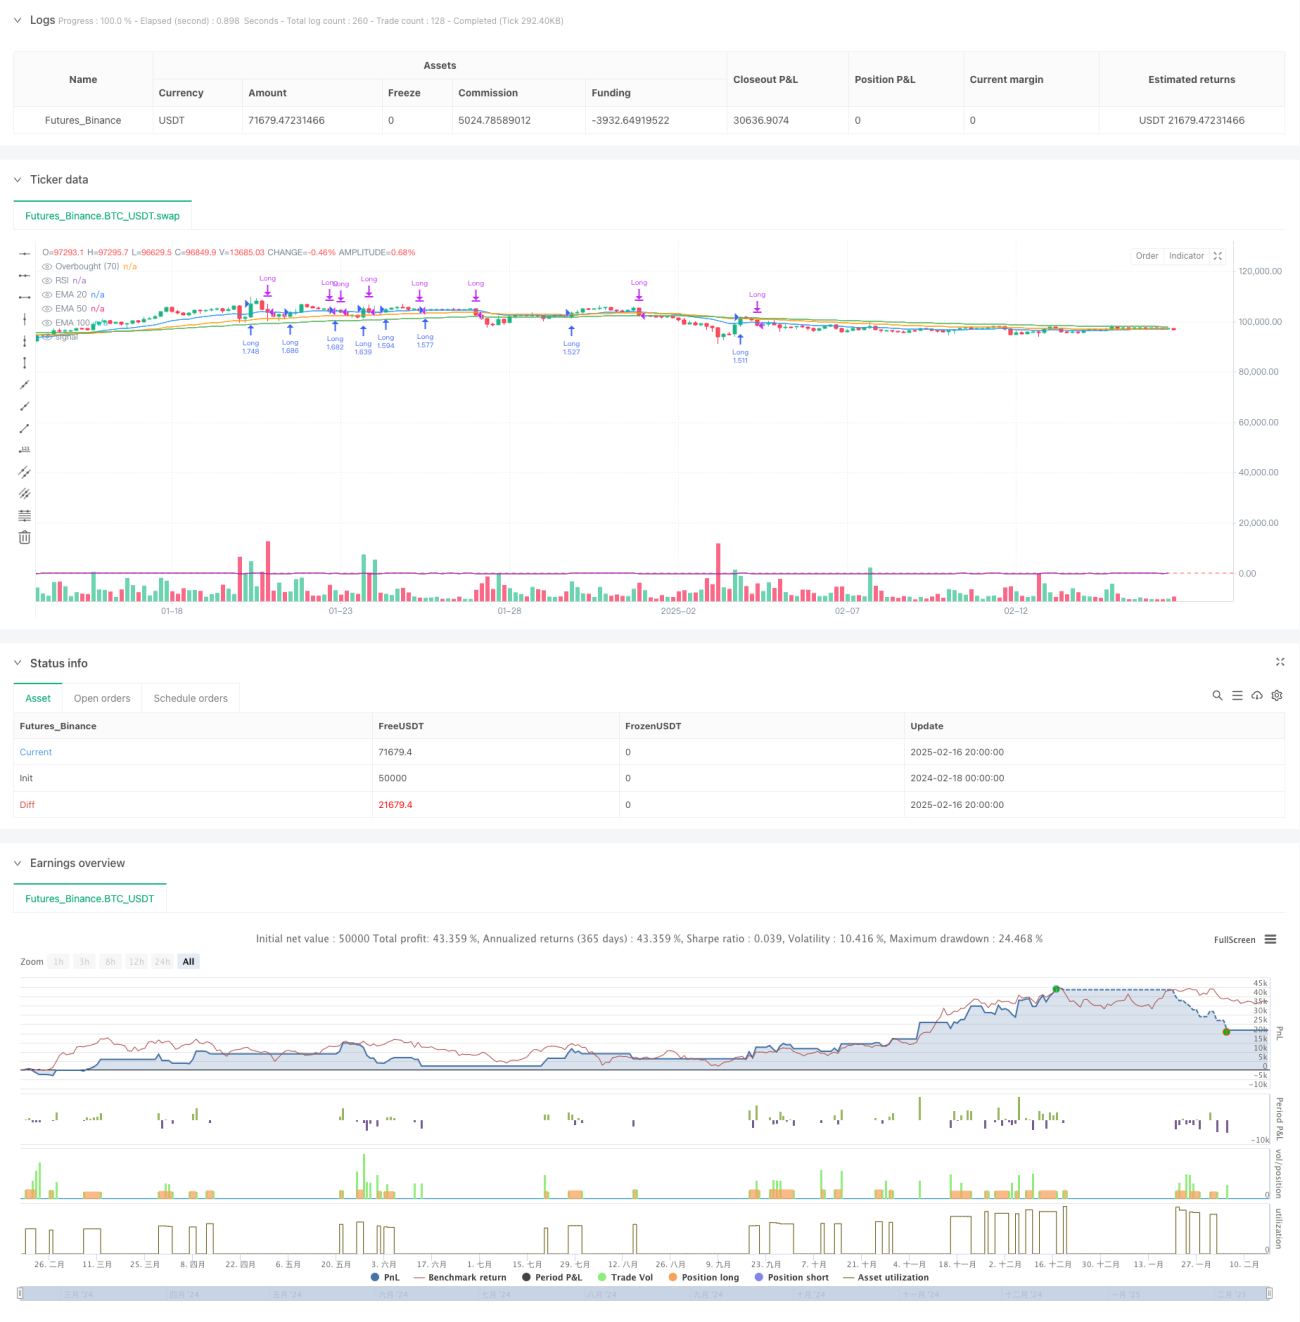
Chiến lược này là một hệ thống giao dịch theo dõi xu hướng dựa trên các chỉ số chuyển động trung bình đa chu kỳ (EMA) và các chỉ số tương đối mạnh (RSI). Chiến lược này đưa ra quyết định giao dịch bằng cách đánh giá xu hướng EMA trong ba chu kỳ 20, 50, 100 kết hợp với tín hiệu vượt mức giá và RSI. Chiến lược này chủ yếu áp dụng cho thị trường xu hướng, để tăng độ chính xác của giao dịch bằng cách xác minh nhiều chỉ số kỹ thuật.
Nguyên tắc chiến lược
Logic cốt lõi của chiến lược bao gồm những phần chính sau:
- Xác định xu hướng: Xác định liệu các đường trung bình của ba chu kỳ (20/50/100) có đang trong xu hướng tăng bằng cách so sánh EMA hiện tại với giá trị của chu kỳ trước
- Điều kiện nhập cảnh: Gửi tín hiệu mua khi giá phá vỡ EMA 20 chu kỳ từ phía dưới và cả ba đường trung bình đang trong xu hướng tăng
- Điều kiện thoát: Hạ lỗ khi RSI vượt quá 70 (thay quá giá) hoặc khi giá giảm xuống dưới 20 chu kỳ EMA
- Quản lý vị trí: Sử dụng tỷ lệ phần trăm của tổng giá trị tài khoản (~10%) để giữ vị trí
Lợi thế chiến lược
- Cơ chế xác nhận nhiều lần: Giảm nguy cơ phá vỡ giả mạo bằng cách xác minh lẫn nhau các chỉ số EMA và RSI trong ba chu kỳ khác nhau
- Theo dõi xu hướng: có thể nắm bắt hiệu quả xu hướng trung và dài hạn, tăng lợi nhuận
- Kiểm soát rủi ro: Sử dụng tín hiệu mua quá mức RSI và giảm đường trung bình làm điều kiện dừng lỗ, kiểm soát hiệu quả việc rút lui
- Quản lý tiền: Sử dụng quản lý tỷ lệ phần trăm để tự động điều chỉnh khối lượng giao dịch theo quy mô tài khoản
- Hoạt động có hệ thống: Quy tắc chiến lược rõ ràng, có thể làm giảm nhiễu ảnh hưởng của phán đoán chủ quan
Rủi ro chiến lược
- Sự chậm trễ: EMA là một chỉ số chậm trễ có thể dẫn đến sự chậm trễ nhỏ trong thời gian nhập cảnh và xuất cảnh
- Rủi ro của thị trường chấn động: có thể tạo ra các tín hiệu sai lệch thường xuyên trong thị trường chấn động ngang
- Rủi ro nhảy vọt: Thị trường nhảy vọt mạnh có thể khiến điểm dừng lỗ bị hỏng
- Tính nhạy cảm của tham số: có thể cần phải điều chỉnh chu kỳ EMA và RSI trong các điều kiện thị trường khác nhau
- Chi phí giao dịch: Giao dịch thường xuyên có thể dẫn đến chi phí giao dịch cao hơn
Hướng tối ưu hóa chiến lược
- Nhận biết môi trường thị trường: Tăng cơ chế phán đoán tình trạng thị trường, tự động giảm vị trí hoặc tạm dừng giao dịch trong thị trường biến động
- Tối ưu hóa tham số động: tự động điều chỉnh chu kỳ EMA và RSI theo biến động của thị trường
- Tối ưu hóa Stop Loss: Tiếp tục theo dõi Stop Loss và bảo vệ lợi nhuận tốt hơn
- Tối ưu hóa nhập cảnh: Tăng cơ chế xác nhận khối lượng giao dịch, tăng độ tin cậy của tín hiệu đột phá
- Tối ưu hóa quản lý vị trí: Điều chỉnh tỷ lệ giữ vị trí theo cường độ xu hướng và biến động của thị trường
Tóm tắt
Đây là một hệ thống chiến lược phức tạp kết hợp theo dõi xu hướng và đảo ngược động lực. Bằng cách sử dụng nhiều chỉ số kỹ thuật kết hợp, trong khi giữ chiến lược đơn giản và dễ hiểu, đặc điểm lợi nhuận rủi ro tốt hơn được thực hiện. Điểm mạnh cốt lõi của chiến lược là cơ chế xác nhận xu hướng nghiêm ngặt và hệ thống kiểm soát rủi ro hoàn thiện, nhưng trong ứng dụng thực tế cần chú ý đến tối ưu hóa tham số và thích ứng với môi trường thị trường.
/*backtest
start: 2024-02-18 00:00:00
end: 2025-02-17 00:00:00
period: 4h
basePeriod: 4h
exchanges: [{"eid":"Futures_Binance","currency":"BTC_USDT"}]
*/

//@version=5
strategy("EMA Crossover + RSI Strategy", overlay=true, initial_capital=10000, default_qty_type=strategy.percent_of_equity, default_qty_value=200)

// Calculate EMAs- 1