Chiến lược giao dịch theo xu hướng trung bình động khối lượng động và đột phá HLCC4

Tổng quan
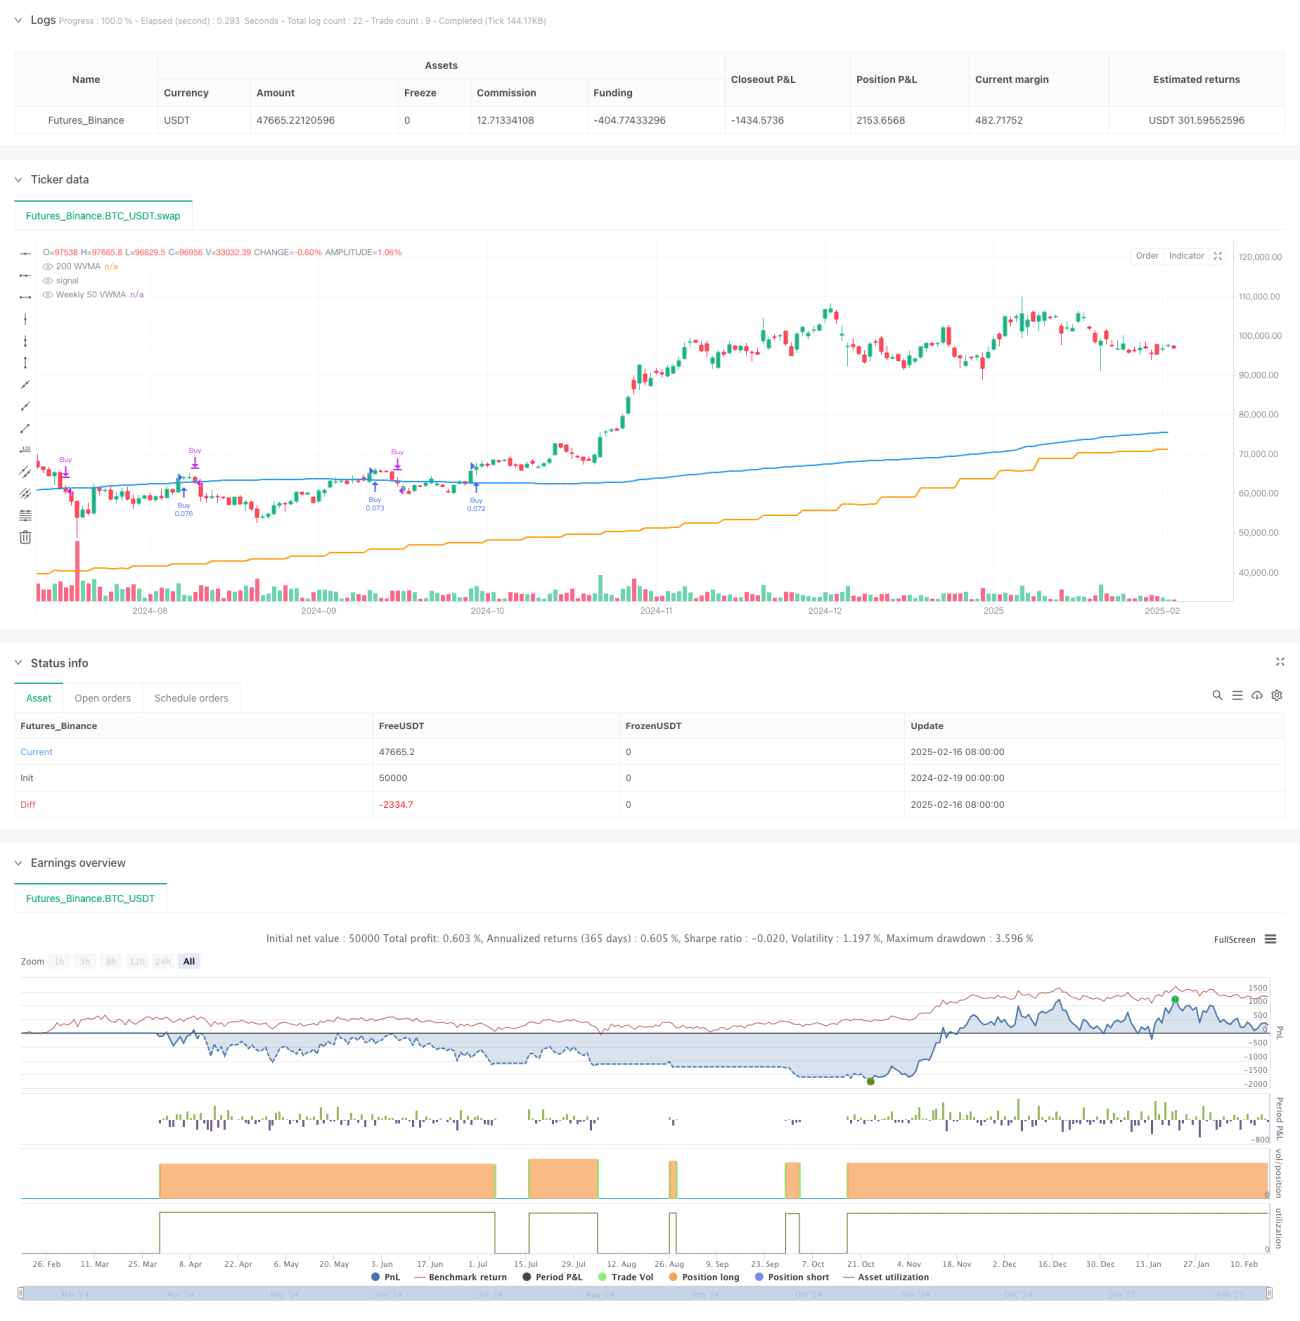
Chiến lược này là một hệ thống theo dõi xu hướng dựa trên nhiều chu kỳ thời gian, kết hợp với đường tròn 50 chu kỳ giao dịch trọng lượng trung bình di chuyển ((VWMA) làm bộ lọc xu hướng lớn và sử dụng 200 chu kỳ VWMA và HLCC4 giá phá vỡ trong chu kỳ thời gian hiện tại như một tín hiệu giao dịch cụ thể. Đây là một chiến lược chỉ làm nhiều hơn để tăng độ tin cậy giao dịch thông qua xác nhận xu hướng nghiêm ngặt và xác minh nhiều chu kỳ thời gian.
Nguyên tắc chiến lược
Lập luận cốt lõi của chiến lược bao gồm một số yếu tố quan trọng:
- Sử dụng đường tròn 50 chu kỳ VWMA như là tiêu chuẩn để đánh giá xu hướng lớn, chỉ khi giá nằm trên đường trung bình này mới được phép mở vị trí.
- Điều kiện nhập là phải đáp ứng cả hai giá đóng cửa liên tiếp của K trên 200 chu kỳ VWMA và giá đóng cửa của K thứ hai cao hơn giá trung bình HLC4 của K đầu tiên.
- Tín hiệu xuất phát dựa trên cấp độ đường nét, giá đóng cửa đường nét trong ngày giảm xuống dưới đường nét 200 chu kỳ VWMA.
- Chiến lược này sử dụng phương thức quản lý vị thế cố định, sử dụng 10% lợi nhuận tài khoản cho mỗi giao dịch.
- Đánh giá thời hạn hàng tuần trong vòng 5 năm gần đây để đảm bảo hiệu quả của chiến lược trong môi trường thị trường gần đây.
Lợi thế chiến lược
- Xác minh nhiều chu kỳ thời gian: Bằng cách kết hợp đường tròn và đường mặt trời, bạn có thể nắm bắt xu hướng lớn và phản ứng kịp thời với sự thay đổi của thị trường.
- Kiểm soát rủi ro: Sử dụng VWMA thay vì trung bình di chuyển đơn giản, để phản ánh tốt hơn sự biến động thực sự của thị trường.
- Xu hướng xác nhận nghiêm ngặt: yêu cầu nhiều điều kiện được đáp ứng cùng một lúc để có thể nhập học, giảm nguy cơ đột phá giả.
- Quản lý vị trí hợp lý: Phương thức quản lý vị trí tỷ lệ cố định kiểm soát rủi ro và duy trì lợi nhuận.
- Mức độ tự động hóa cao: Chiến lược logic rõ ràng, giao dịch hoàn toàn có thể tự động hóa.
Rủi ro chiến lược
- Rủi ro đảo ngược xu hướng: Trong bối cảnh thị trường biến động mạnh, có thể có một sự rút lui lớn.
- Tác động điểm trượt: Giá giao dịch thực tế có thể lệch so với giá lý thuyết khi thị trường thiếu lưu động.
- Tín hiệu chậm trễ: Do sử dụng đường trung bình có chu kỳ dài hơn, phản ứng của chiến lược có thể bị chậm trễ ở các điểm chuyển hướng.
- Rủi ro đột phá giả mạo: Mặc dù đã xác nhận nhiều lần, nhưng vẫn có thể gặp phải thiệt hại do đột phá giả mạo.
- Hạn chế giao dịch một chiều: Chiến lược chỉ làm nhiều hơn, sẽ bỏ lỡ cơ hội giảm giá tiềm năng trong xu hướng giảm.
Hướng tối ưu hóa chiến lược
- Tối ưu hóa tham số động: Các tham số chu kỳ của VWMA có thể được điều chỉnh tự động theo biến động của thị trường.
- Tối ưu hóa quản lý vị thế: giới thiệu hệ thống quản lý vị thế động dựa trên tỷ lệ biến động.
- Cải thiện cơ chế xuất cảnh: có thể thêm dừng di động hoặc dừng động dựa trên chỉ số kỹ thuật.
- Tăng các chỉ số cảm xúc thị trường: kết hợp với các chỉ số như RSI hoặc MACD để tăng độ tin cậy của tín hiệu.
- Giới thiệu phân tích khối lượng giao dịch: Phân tích sâu về khối lượng giao dịch, tối ưu hóa phương pháp tính toán VWMA.
Tóm tắt
Đây là một chiến lược theo dõi xu hướng nghiêm ngặt được thiết kế, kiểm soát rủi ro tốt hơn thông qua sự kết hợp nhiều chu kỳ thời gian và điều kiện giao dịch nghiêm ngặt. Ưu điểm cốt lõi của chiến lược là cơ chế xác nhận xu hướng hoàn hảo và logic giao dịch rõ ràng, phù hợp để nắm bắt cơ hội xu hướng trung và dài hạn trong thị trường mạnh.
/*backtest
start: 2024-02-19 00:00:00
end: 2025-02-17 00:00:00
period: 1d
basePeriod: 1d
exchanges: [{"eid":"Futures_Binance","currency":"BTC_USDT"}]
*/

//@version=6
strategy("Long-Only 200 WVMA + HLCC4 Strategy (Weekly 50 VWMA Filter, Daily Exit, Last 5 Years)", overlay=true, default_qty_type=strategy.percent_of_equity, default_qty_value=10)

// Parameters- 1