Tổng quan
Đây là một chiến lược giao dịch dựa trên SMA (trung bình di chuyển đơn giản) dựa trên giá trị giá trị Delta của khối lượng mua và bán trong một năm. Chiến lược này xác định các tín hiệu giao dịch tiềm năng bằng cách tính toán trung bình di chuyển của giá trị chênh lệch khối lượng mua và bán và so sánh nó với các điểm thấp và cao trong lịch sử. Chiến lược sử dụng thời gian lùi dài, phù hợp với giao dịch xu hướng trung và dài hạn.
Nguyên tắc chiến lược
Logic cốt lõi của chiến lược này dựa trên các bước chính sau:
- Tính toán Delta: Tính toán chênh lệch mua bán bằng cách phân tích biến động giá. Khi giá đóng cửa cao hơn giá mở cửa, nó được ghi lại là số lượng mua, ngược lại là số lượng bán.
- Xử lý trơn SMA: Xử lý trung bình di chuyển 14 chu kỳ cho giá trị Delta để giảm tiếng ồn.
- Xác định điểm cao và thấp trong một năm: Tính toán Delta SMA cho các mức cao nhất và thấp nhất trong năm qua.
- Điều kiện kích hoạt:
- Tín hiệu mua: được kích hoạt khi Delta SMA phá vỡ 0 sau khi giảm 70% dưới mức thấp trong một năm
- Giao thức bán: kích hoạt khi Delta SMA vượt mức cao 90% trong một năm và giảm 60%
Lợi thế chiến lược
- Khả năng nắm bắt xu hướng dài hạn: Có khả năng nắm bắt các xu hướng chính một cách hiệu quả thông qua phân tích dữ liệu lịch sử trong một năm.
- Hiệu quả lọc tiếng ồn tốt: Sử dụng xử lý trơn tru SMA và điều kiện đa threshold, giảm hiệu quả tín hiệu giả.
- Kiểm soát rủi ro hợp lý: Đặt các điều kiện nhập cảnh và xuất cảnh rõ ràng, tránh giao dịch quá mức.
- Khả năng thích ứng: Các tham số chiến lược có thể được điều chỉnh theo các điều kiện thị trường khác nhau.
Rủi ro chiến lược
- Rủi ro về sự chậm trễ: Có thể gây ra tín hiệu chậm trễ do sử dụng SMA và thời gian quay ngược dài.
- Rủi ro phá vỡ giả: Có thể tạo ra tín hiệu sai trong thị trường bất ổn.
- Tùy thuộc vào môi trường thị trường: có thể hoạt động kém trong thị trường không có xu hướng rõ ràng.
- Tính nhạy cảm của tham số: Thiết lập ngưỡng có ảnh hưởng lớn đến hiệu suất của chiến lược.
Hướng tối ưu hóa chiến lược
- Điều chỉnh giảm giá động: Có thể điều chỉnh giảm giá cao thấp theo động lực biến động của thị trường.
- Tăng các chỉ số phụ trợ: Tăng độ tin cậy tín hiệu kết hợp với các chỉ số kỹ thuật khác.
- Tham gia vào cơ chế dừng lỗ: Thiết lập dừng động để kiểm soát rủi ro.
- Trình lọc môi trường thị trường: Thêm logic phán đoán môi trường thị trường, vận hành chiến lược trong môi trường phù hợp.
Tóm tắt
Đây là một chiến lược theo dõi xu hướng trung và dài hạn dựa trên phân tích khối lượng giao dịch, để nắm bắt xu hướng thị trường bằng cách phân tích giá trị chênh lệch mua bán cao và thấp. Chiến lược được thiết kế hợp lý, rủi ro được kiểm soát, nhưng cần chú ý đến vấn đề thích ứng với môi trường thị trường và tối ưu hóa tham số.
/*backtest
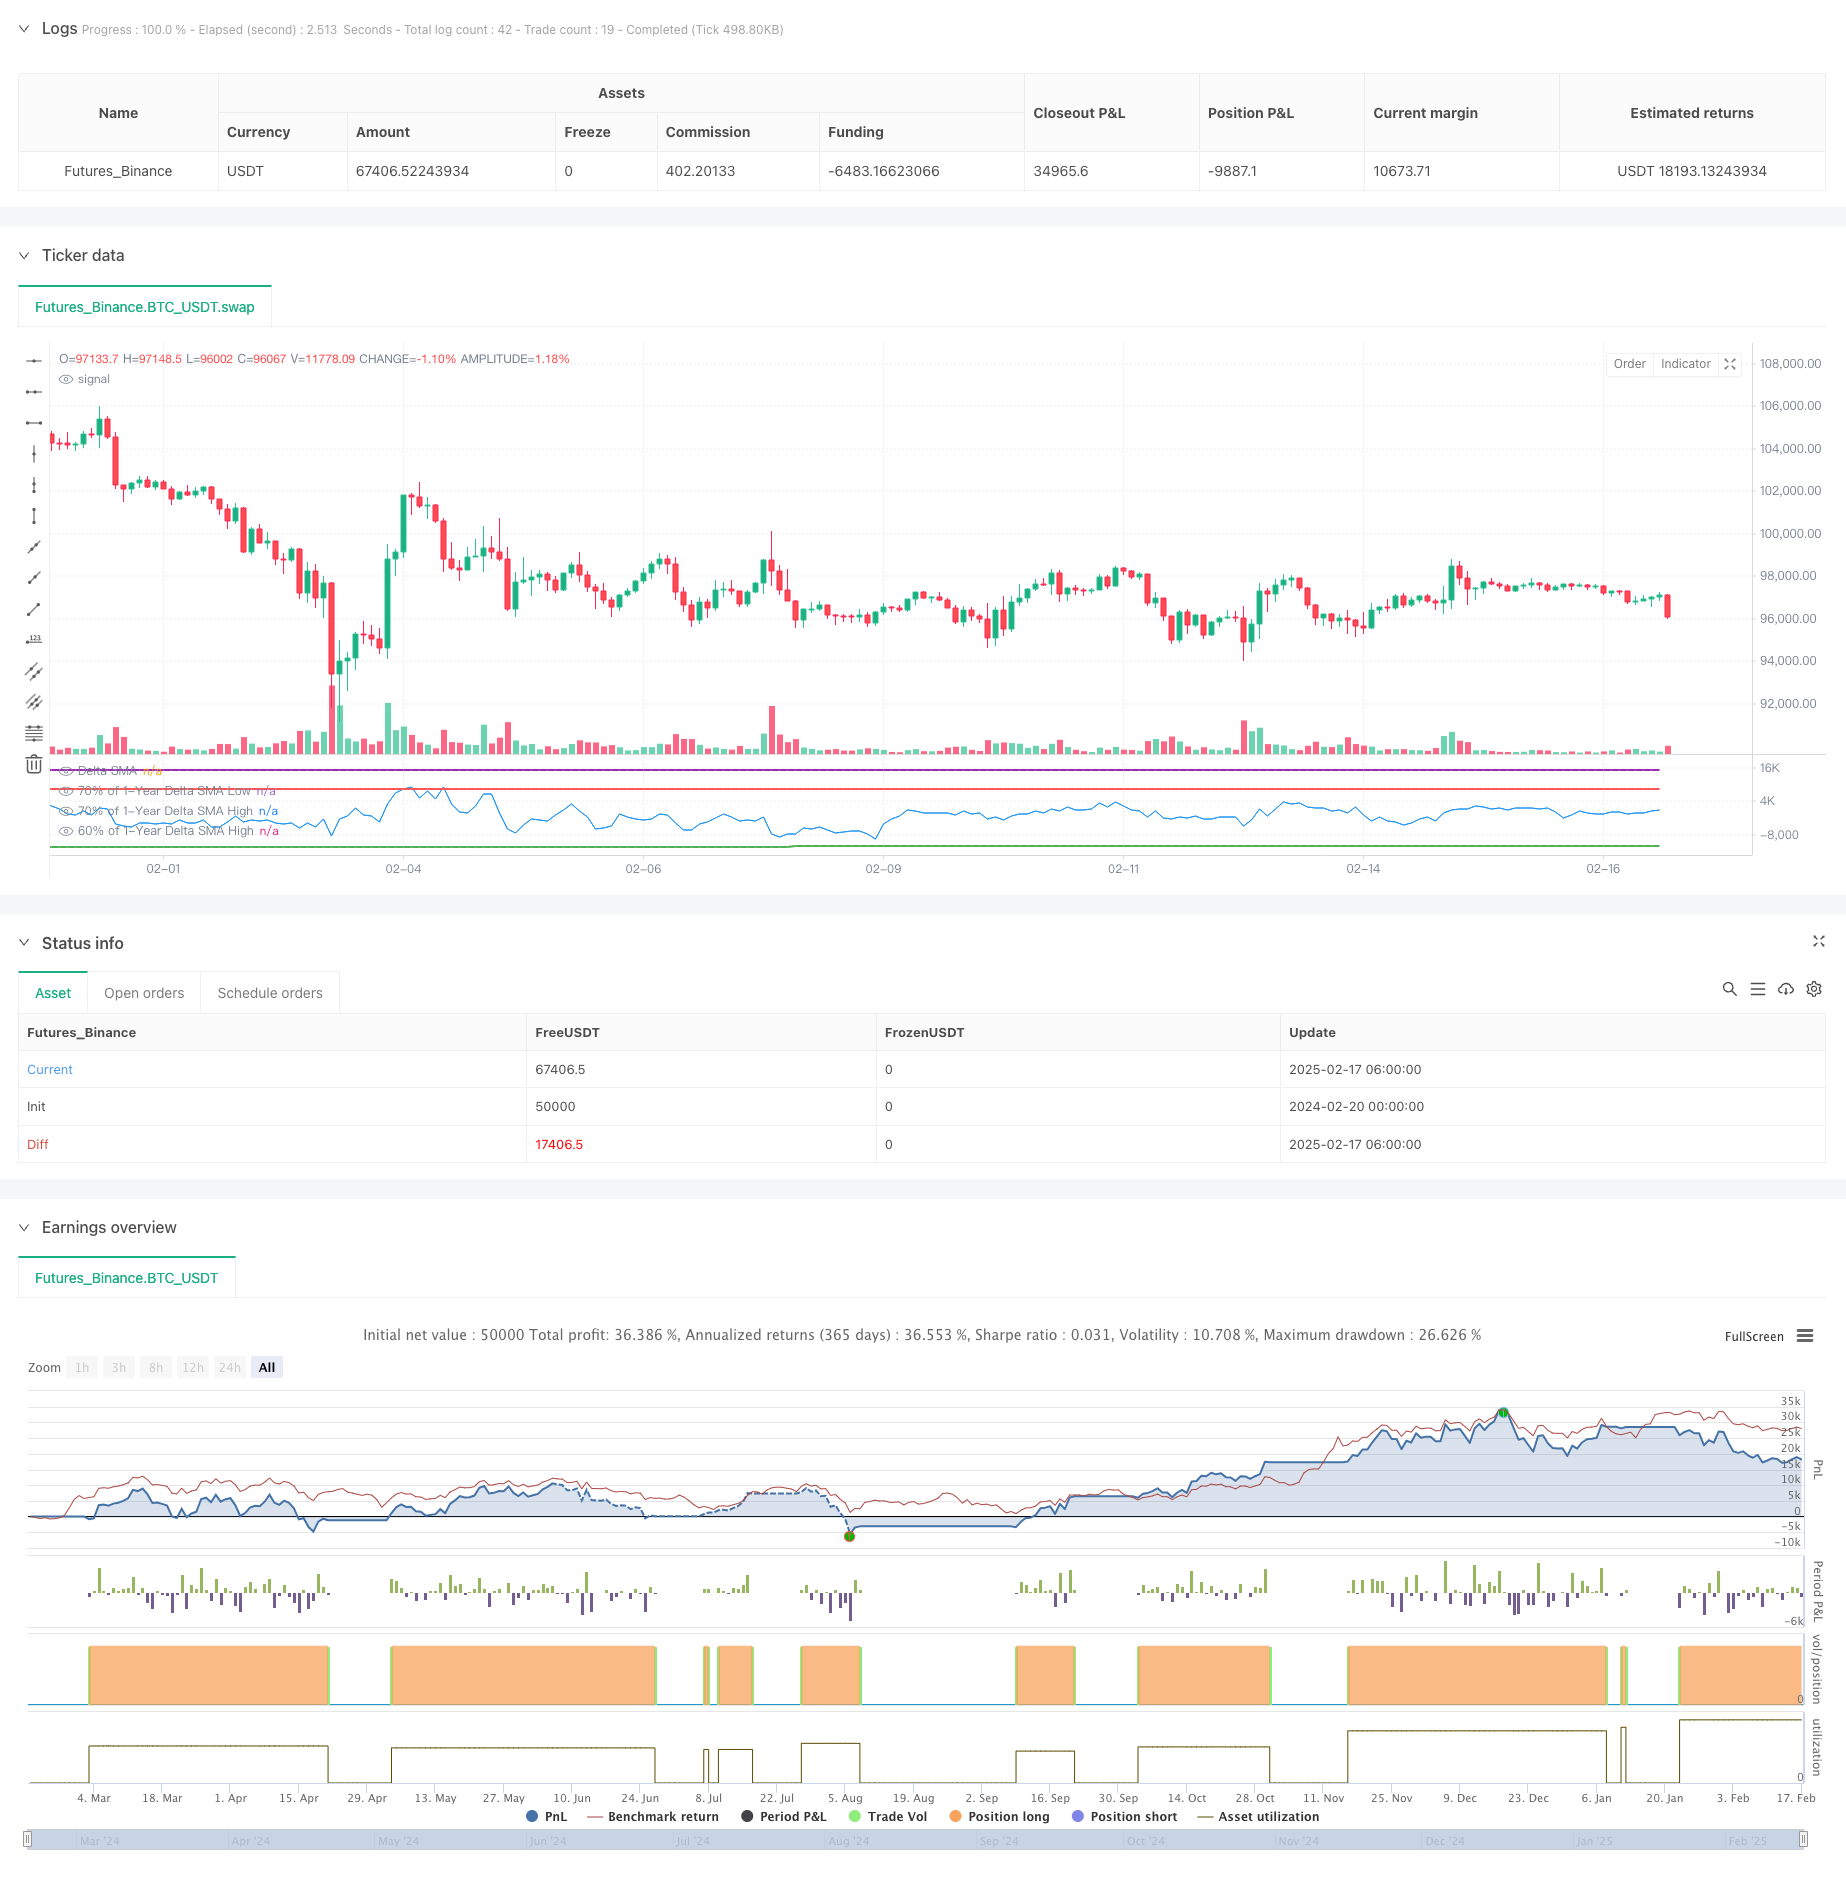
start: 2024-02-20 00:00:00
end: 2025-02-17 08:00:00
period: 2h
basePeriod: 2h
exchanges: [{"eid":"Futures_Binance","currency":"BTC_USDT"}]
*/
//@version=5
strategy("Delta SMA 1-Year High/Low Strategy", overlay = false, margin_long = 100, margin_short = 100)
// Inputs
delta_sma_length = input.int(14, title="Delta SMA Length", minval=1) // SMA length for Delta
lookback_days = 365 // Lookback period fixed to 1 year
// Function to calculate buy and sell volume
buy_volume = close > open ? volume : na
sell_volume = close < open ? volume : na
// Calculate the Delta
delta = nz(buy_volume, 0) - nz(sell_volume, 0)
// Calculate Delta SMA
delta_sma = ta.sma(delta, delta_sma_length)
// Lookback period in bars (1 bar = 1 day)
desired_lookback_bars = lookback_days
// Ensure lookback doesn't exceed available historical data
max_lookback_bars = math.min(desired_lookback_bars, 365) // Cap at 365 bars (1 year)
// Calculate Delta SMA low and high within the valid lookback period
delta_sma_low_1yr = ta.lowest(delta_sma, max_lookback_bars)
delta_sma_high_1yr = ta.highest(delta_sma, max_lookback_bars)
// Define thresholds for buy and sell conditions
very_low_threshold = delta_sma_low_1yr * 0.7
above_70_threshold = delta_sma_high_1yr * 0.9
below_60_threshold = delta_sma_high_1yr * 0.5
// Track if `delta_sma` was very low and persist the state
var bool was_very_low = false
if delta_sma < very_low_threshold
was_very_low := true
if ta.crossover(delta_sma, 10000)
was_very_low := false // Reset after crossing 0
// Track if `delta_sma` crossed above 70% of the high
var bool crossed_above_70 = false
if ta.crossover(delta_sma, above_70_threshold)
crossed_above_70 := true
if delta_sma < below_60_threshold*0.5 and crossed_above_70
crossed_above_70 := false // Reset after triggering sell
// Buy condition: `delta_sma` was very low and now crosses 0
buy_condition = was_very_low and ta.crossover(delta_sma, 0)
// Sell condition: `delta_sma` crossed above 70% of the high and now drops below 60%
sell_condition = crossed_above_70 and delta_sma < below_60_threshold
// Place a long order when buy condition is met
if buy_condition
strategy.entry("Buy", strategy.long)
// Place a short order when sell condition is met
if sell_condition
strategy.close("Buy")
// Plot Delta SMA and thresholds for visualization
plot(delta_sma, color=color.blue, title="Delta SMA")
plot(very_low_threshold, color=color.green, title="70% of 1-Year Delta SMA Low", linewidth=2)
plot(above_70_threshold, color=color.purple, title="70% of 1-Year Delta SMA High", linewidth=2)
plot(below_60_threshold, color=color.red, title="60% of 1-Year Delta SMA High", linewidth=2)
// Optional: Plot Buy and Sell signals on the chart
//plotshape(series=buy_condition, title="Buy Signal", location=location.belowbar, color=color.new(color.green, 0), style=shape.labelup, text="BUY")
//plotshape(series=sell_condition, title="Sell Signal", location=location.abovebar, color=color.new(color.red, 0), style=shape.labeldown, text="SELL")