
Tổng quan
Chiến lược này là một hệ thống giao dịch tổng hợp kết hợp các mức Fibonacci Reversal, Moving Average Crossover và định hướng động lực. Nó tạo ra tín hiệu giao dịch bằng cách giao dịch giữa các đường trung bình di chuyển nhanh và đường trung bình di chuyển chậm, đồng thời sử dụng mức Fibonacci Reversal như một điểm tham chiếu giá trị quan trọng và kết hợp với định hướng để tối ưu hóa thời gian giao dịch. Hệ thống cũng tích hợp các thiết lập dừng lỗ và dừng phần trăm để quản lý rủi ro.
Nguyên tắc chiến lược
Logic cốt lõi của chiến lược này dựa trên các yếu tố chính sau:
- Hệ thống chéo đường trung bình di chuyển sử dụng đường trung bình di chuyển đơn giản ngày 9 và 21 ((SMA) làm chỉ số tín hiệu
- Các mức thu hồi Fibonacci được tính trong 100 chu kỳ (23.6%, 38.2%, 50%, 61.8%) được sử dụng để phân tích cấu trúc thị trường
- Xác định xu hướng thị trường thông qua mối quan hệ giữa giá và vị trí của đường trung bình nhanh
- Tín hiệu xây dựng nhà kho được kích hoạt bởi đường trung bình tốc độ nhanh trên đường trung bình tốc độ chậm (( làm nhiều hơn) hoặc đường trung bình tốc độ chậm dưới đường trung bình (( làm trống)
- Hệ thống tự động thiết lập mức dừng lỗ và dừng chân dựa trên tỷ lệ phần trăm giá nhập
Lợi thế chiến lược
- Phân tích đa chiều: kết hợp ba yếu tố được công nhận nhất trong phân tích kỹ thuật: xu hướng, động lực và mức giá
- Quản lý rủi ro tốt hơn: sử dụng tỷ lệ dừng lỗ dự kiến để bảo vệ an toàn tài chính
- Khả năng hiển thị cao: hiển thị rõ ràng tất cả các mức giá quan trọng và tín hiệu giao dịch trên biểu đồ
- Khả năng thích ứng: có thể điều chỉnh thông qua các tham số để thích ứng với các môi trường thị trường khác nhau
- Quy tắc hoạt động rõ ràng: Điều kiện tạo tín hiệu rõ ràng, tránh phán đoán chủ quan
Rủi ro chiến lược
- Hệ thống đường trung bình di động có thể tạo ra tín hiệu giả trong thị trường biến động
- Cài đặt Stop Loss ở tỷ lệ cố định có thể không phù hợp với tất cả các môi trường thị trường
- Trong một thị trường biến động cao, giá có thể vượt qua điểm dừng lỗ nhanh chóng.
- Tính hiệu quả của mức Fibonacci có thể thay đổi theo điều kiện thị trường
- Xu hướng đánh giá có thể bị trì hoãn tại các điểm chuyển đổi của thị trường
Hướng tối ưu hóa chiến lược
- Tiếp theo, tính năng này sẽ được sử dụng để điều chỉnh tỷ lệ dừng lỗ.
- Thêm phân tích khối lượng giao dịch để xác nhận tín hiệu giao dịch
- Xem xét xác nhận trong các chu kỳ thời gian khác nhau để tăng độ tin cậy tín hiệu
- Tham gia các điều kiện lọc môi trường thị trường, giao dịch trong điều kiện thị trường phù hợp
- Phát triển hệ thống tối ưu hóa tham số thích ứng
Tóm tắt
Đây là một chiến lược giao dịch tổng hợp kết hợp nhiều công cụ phân tích kỹ thuật cổ điển. Bằng cách kết hợp moving averages, Fibonacci retracements và phân tích xu hướng, chiến lược có thể nắm bắt các cơ hội giao dịch tiềm năng trên thị trường. Đồng thời, hệ thống quản lý rủi ro tốt và giao diện trực quan rõ ràng làm cho nó có tính thực tế tốt. Mặc dù có một số rủi ro vốn có, chiến lược này có khả năng hoạt động tốt hơn trong giao dịch thực tế thông qua việc tối ưu hóa và cải tiến liên tục.
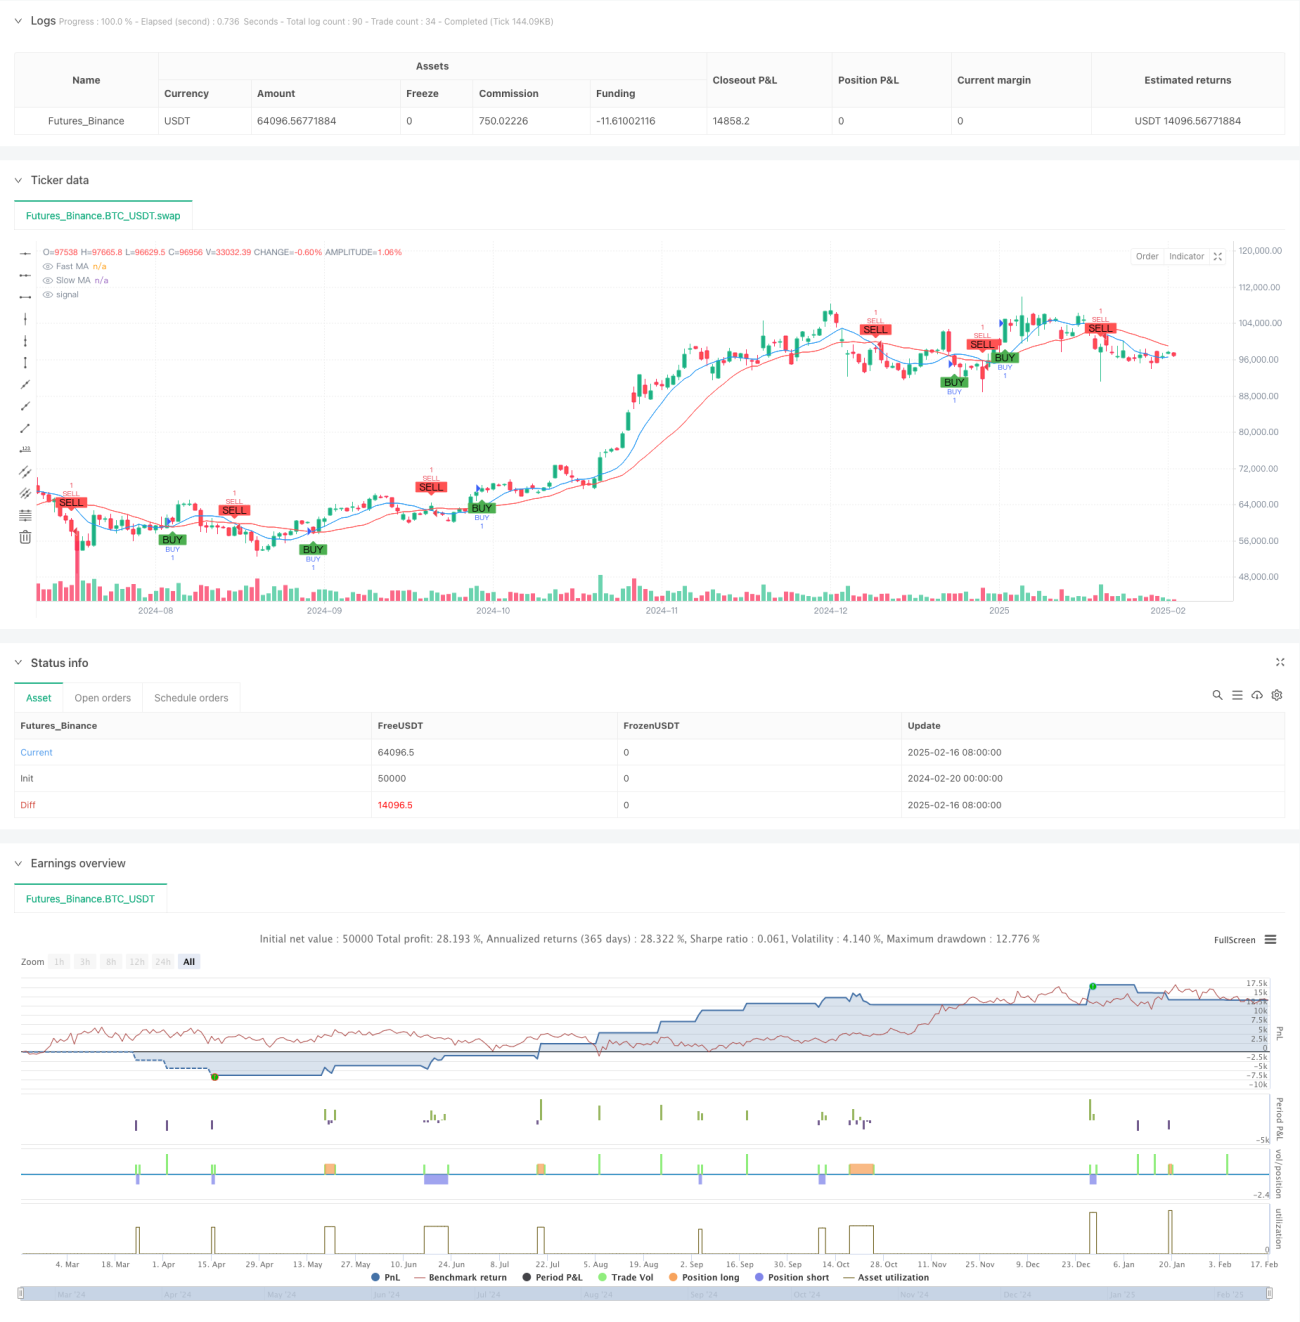
/*backtest
start: 2024-02-20 00:00:00
end: 2025-02-17 08:00:00
period: 1d
basePeriod: 1d
exchanges: [{"eid":"Futures_Binance","currency":"BTC_USDT"}]
*/

//@version=5
strategy("Buy/Sell Strategy with TP, SL, Fibonacci Levels, and Trend", overlay=true)

// Input for stop loss and take profit percentages- 1