Chiến lược giao dịch định lượng nâng cao theo dõi xu hướng đa chỉ số

Tổng quan
Chiến lược này là một chiến lược theo dõi xu hướng dựa trên nhiều chỉ số kỹ thuật, tích hợp nhiều chỉ số kỹ thuật như đường trung bình di chuyển (EMA), chỉ số xu hướng trung bình (ADX) và chỉ số tương đối yếu (RSI) và kết hợp các phương pháp phân tích nhiều khung thời gian. Chiến lược chủ yếu xác nhận hướng xu hướng bằng cách giao chéo EMA nhanh và chậm, sử dụng ADX để lọc cường độ xu hướng, thông qua RSI để đánh giá động lực thị trường, do đó giao dịch tần suất cao trên biểu đồ 1 phút.
Nguyên tắc chiến lược
Chiến lược hoạt động dựa trên cơ chế cốt lõi sau:
- Sử dụng EMA 50 chu kỳ và 200 chu kỳ để xác định hướng xu hướng, xác nhận tín hiệu đầu vào bằng đường nhanh và đường chậm
- Sử dụng chỉ số ADX ((14 chu kỳ) để đánh giá cường độ xu hướng, chỉ tham gia khi ADX lớn hơn 25 để tránh thị trường rung động
- Phân tích động lực kết hợp với chỉ số RSI ((14 chu kỳ), xem xét mua nhiều khi RSI thấp hơn 30 và xem xét mua ít khi RSI cao hơn 70
- Nhập phân tích EMA trong khung thời gian 4 giờ, tăng độ tin cậy của phán đoán xu hướng thông qua xác nhận nhiều khung thời gian
- Thiết lập động dừng dừng lỗ, làm thêm thời gian dừng lỗ nằm ở mức 5% của giá nhập, dừng lỗ nằm ở mức 2%; làm giảm giá tương ứng ngược lại
Lợi thế chiến lược
- Xác thực chéo đa chỉ số, tăng đáng kể độ tin cậy tín hiệu
- Có cơ chế kiểm soát rủi ro tốt, bao gồm dừng động và quản lý vị trí dựa trên biến động
- Sử dụng phân tích nhiều khung thời gian để giảm nguy cơ đột nhập giả
- Tỷ lệ chiến thắng cao và tỷ lệ lỗ trung bình, có lợi nhuận mong đợi tốt
- Logic chiến lược rõ ràng, dễ hiểu và dễ duy trì
Rủi ro chiến lược
- Sự biến động nhanh chóng và mạnh mẽ của thị trường có thể gây ra hiệu quả dừng lỗ
- Thị trường biến động ngang có thể tạo ra giao dịch thường xuyên, tăng chi phí giao dịch
- Chỉ số EMA tự nó bị tụt hậu, có thể bỏ lỡ thời điểm tốt nhất để tham gia
- Nhiều chỉ số có thể tạo ra các tín hiệu mâu thuẫn
- Giao dịch 1 phút có yêu cầu cao về tốc độ thực hiện và có thể có nguy cơ trượt
Hướng tối ưu hóa chiến lược
- Tối ưu hóa các tham số ADX để cải thiện độ chính xác nhận định xu hướng
- Tiến hành quản lý vị thế động dựa trên ATR để thích ứng tốt hơn với biến động của thị trường
- Tăng kích thước phân tích khối lượng và cải thiện độ tin cậy của tín hiệu
- Xem xét thêm phân loại môi trường thị trường, sử dụng các tham số khác nhau trong các điều kiện thị trường khác nhau
- Bạn có thể thử tích hợp các thuật toán học máy để tối ưu hóa lựa chọn tham số.
Tóm tắt
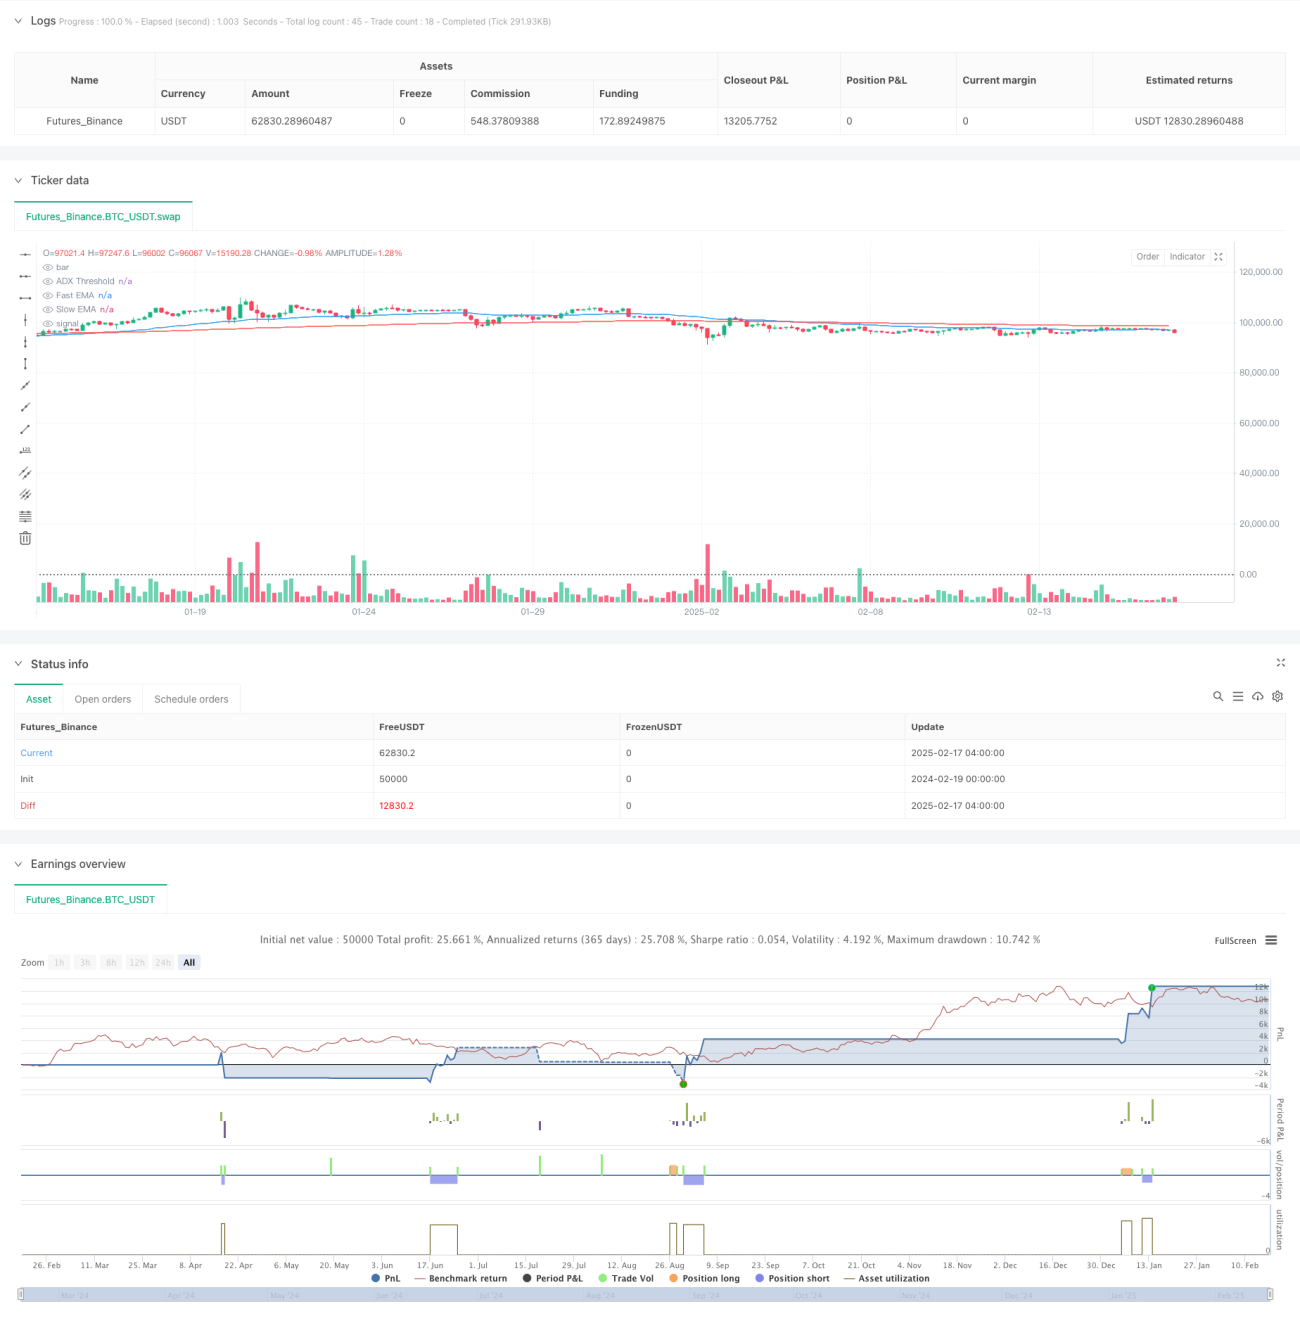
Chiến lược này xây dựng một hệ thống theo dõi xu hướng vững chắc thông qua sự phối hợp hợp của nhiều chỉ số kỹ thuật. Chiến lược này đạt được lợi nhuận đáng kể thông qua cơ chế kiểm soát rủi ro tốt, trong khi vẫn duy trì tỷ lệ thắng cao. Mặc dù có một số không gian tối ưu hóa, nhưng hiệu suất tổng thể là thỏa đáng, đặc biệt phù hợp với các nhà giao dịch theo đuổi lợi nhuận ổn định.
/*backtest
start: 2024-02-19 00:00:00
end: 2025-02-17 08:00:00
period: 4h
basePeriod: 4h
exchanges: [{"eid":"Futures_Binance","currency":"BTC_USDT"}]
*/

//@version=5
strategy("Enhanced Trend Following Strategy", overlay=true, default_qty_type=strategy.percent_of_equity, default_qty_value=200)

// === INPUTS ===- 1