Chiến lược giao dịch định lượng giao thoa xu hướng động đa chỉ báo

Tổng quan
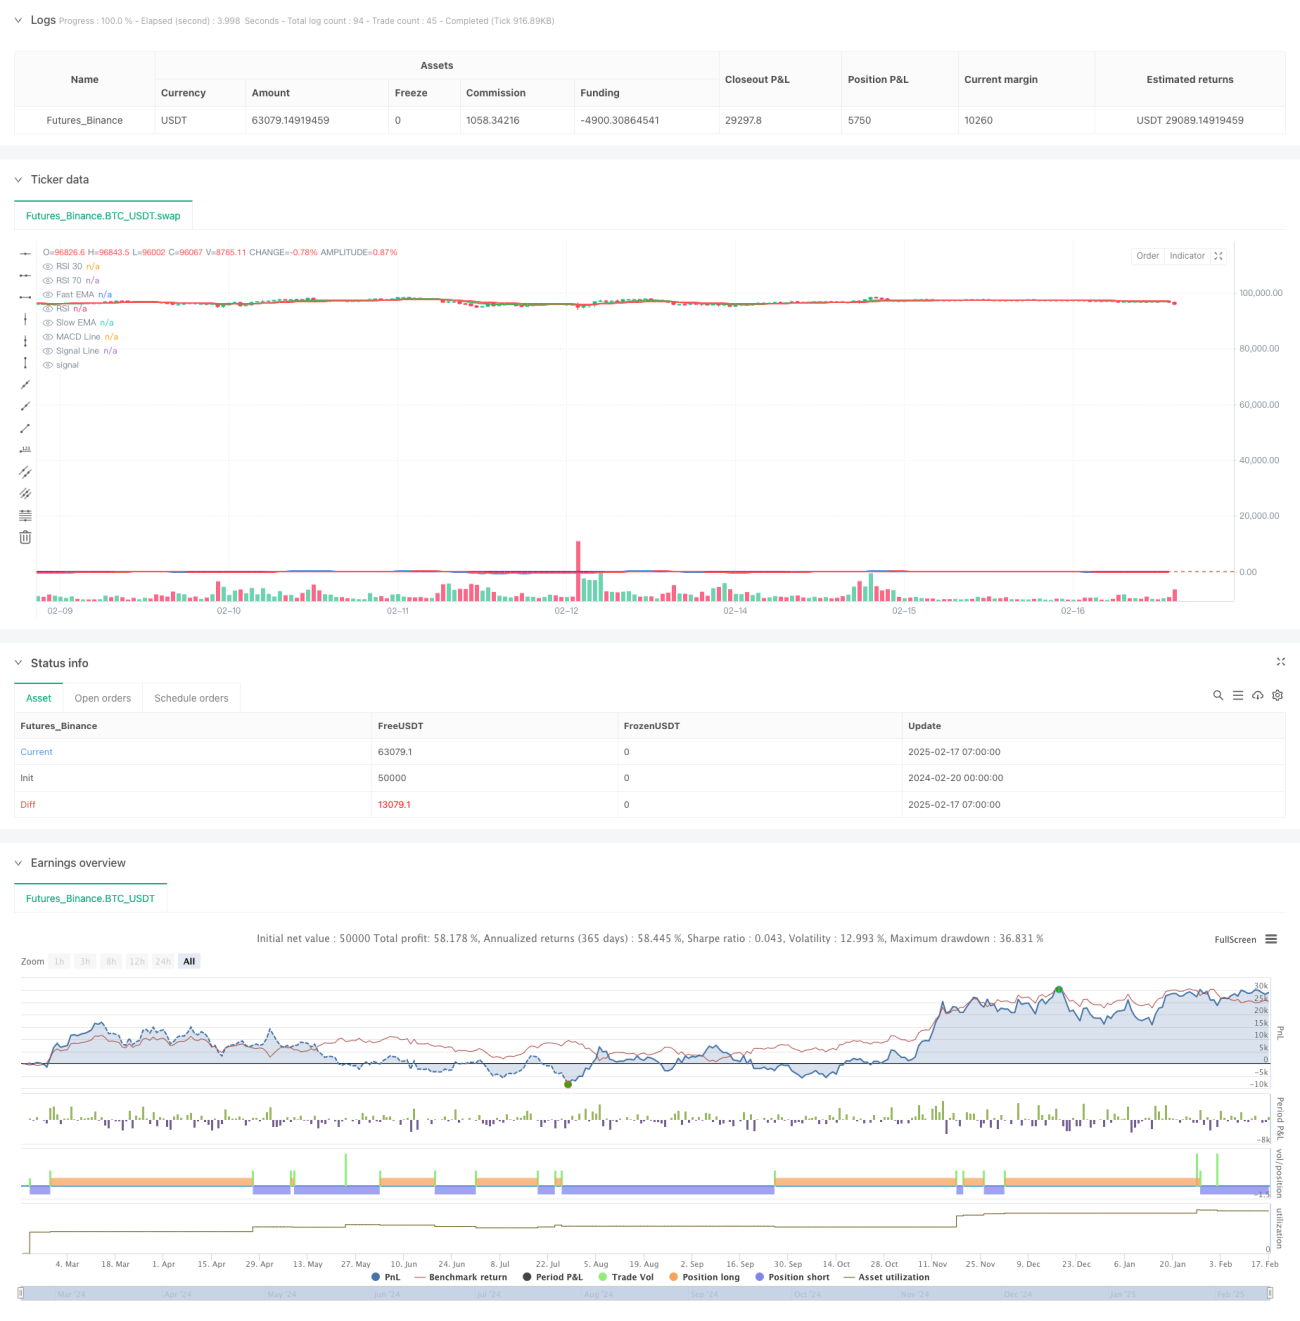
Chiến lược này là một hệ thống giao dịch theo dõi xu hướng dựa trên nhiều chỉ số kỹ thuật, kết hợp ba chỉ số kỹ thuật cổ điển là moving average (EMA), moving average convergence (MACD) và tương đối mạnh (RSI) để giao dịch bằng cách nắm bắt sự thay đổi và động lực của xu hướng thị trường. Chiến lược này sử dụng các tham số thiết lập như EMA (9 chu kỳ) và EMA (21 chu kỳ), MACD (12,26,9) và RSI (14) để phát ra tín hiệu giao dịch khi chỉ số vượt qua và phá vỡ ngưỡng.
Nguyên tắc chiến lược
Lập luận cốt lõi của chiến lược là xác định các điểm biến của xu hướng thị trường thông qua xác nhận đồng bộ của nhiều chỉ số kỹ thuật. Cụ thể, xác nhận tín hiệu bao gồm ba khía cạnh sau:
- Tín hiệu chéo EMA: Tín hiệu chéo EMA được coi là tín hiệu đa khi EMA nhanh đi lên, tín hiệu chéo EMA chậm đi xuống.
- Tín hiệu chéo MACD: Đường MACD xác nhận làm nhiều khi đi qua đường tín hiệu lên, xác nhận làm trống khi đi xuống.
- Bộ lọc RSI: Cho phép giao dịch khi RSI nằm trong khoảng 30-70, tránh giao dịch quá mức trong khu vực mua quá mức.
Chiến lược sẽ thực hiện các hoạt động giao dịch tương ứng chỉ khi ba chỉ số xuất hiện cùng một lúc.
Lợi thế chiến lược
- Xác thực chéo đa chỉ số, giảm hiệu quả các tín hiệu giả.
- Kết hợp với theo dõi xu hướng và các chỉ số động lực, nó có thể nắm bắt chính xác hơn các điểm biến động của thị trường.
- RSI có thể được sử dụng để ngăn chặn các giao dịch trong khu vực quá mua và quá bán.
- Chính sách logic rõ ràng, dễ dàng điều chỉnh tham số và tối ưu hóa.
- Có thể giao dịch đồng thời với giao dịch mua và bán để thích ứng với các môi trường thị trường khác nhau.
Rủi ro chiến lược
- Xác nhận đa chỉ số có thể gây ra sự chậm trễ tín hiệu, bỏ lỡ thời gian nhập cảnh tốt nhất.
- Các tín hiệu chéo có thể xảy ra thường xuyên trong thị trường dao động ngang, làm tăng chi phí giao dịch.
- Mức giới hạn RSI cố định có thể không đủ linh hoạt trong các môi trường thị trường khác nhau.
- Không thiết lập các cơ chế dừng lỗ và ngăn chặn, có thể chịu tổn thất lớn trong biến động lớn.
- Lựa chọn tham số chỉ số kỹ thuật cần được xác minh bằng dữ liệu lịch sử đầy đủ.
Hướng tối ưu hóa chiến lược
- Tiếp theo, chúng ta sẽ đưa ra các tham số chỉ số thích ứng, điều chỉnh theo biến động của thị trường.
- Thêm hệ thống dừng lỗ để kiểm soát rủi ro giao dịch đơn lẻ.
- Tăng xác thực chỉ số giao dịch, tăng tín hiệu đáng tin cậy.
- Phát triển mô-đun nhận diện môi trường thị trường, sử dụng các tham số giao dịch khác nhau trong các trạng thái thị trường khác nhau.
- Thêm mô-đun quản lý tiền để điều chỉnh kích thước vị thế theo sự biến động rủi ro của tài khoản.
- Xem xét thêm bộ lọc cường độ của xu hướng và tránh giao dịch trong xu hướng yếu.
Tóm tắt
Chiến lược này được kiểm chứng chéo của nhiều chỉ số kỹ thuật để nắm bắt sự thay đổi của xu hướng thị trường, có độ tin cậy và khả năng thích ứng tốt hơn. Tuy nhiên, trong ứng dụng thực tế, vẫn cần chú ý đến các vấn đề như trễ tín hiệu và giao dịch quá mức, khuyến nghị tối ưu hóa bằng cách giới thiệu các tham số thích ứng, cơ chế dừng lỗ và nhận diện môi trường thị trường để nâng cao tính ổn định và khả năng lợi nhuận của chiến lược. Trong quá trình sử dụng, khuyến nghị kiểm tra dữ liệu lịch sử đầy đủ và tối ưu hóa tham số và liên tục điều chỉnh và hoàn thiện theo hiệu quả giao dịch thực tế.
- 1