Chiến lược dừng lỗ ATR xu hướng đám mây sóng động
Ichimoku Cloud ATR Senkou Span CHIKOU SPAN SMA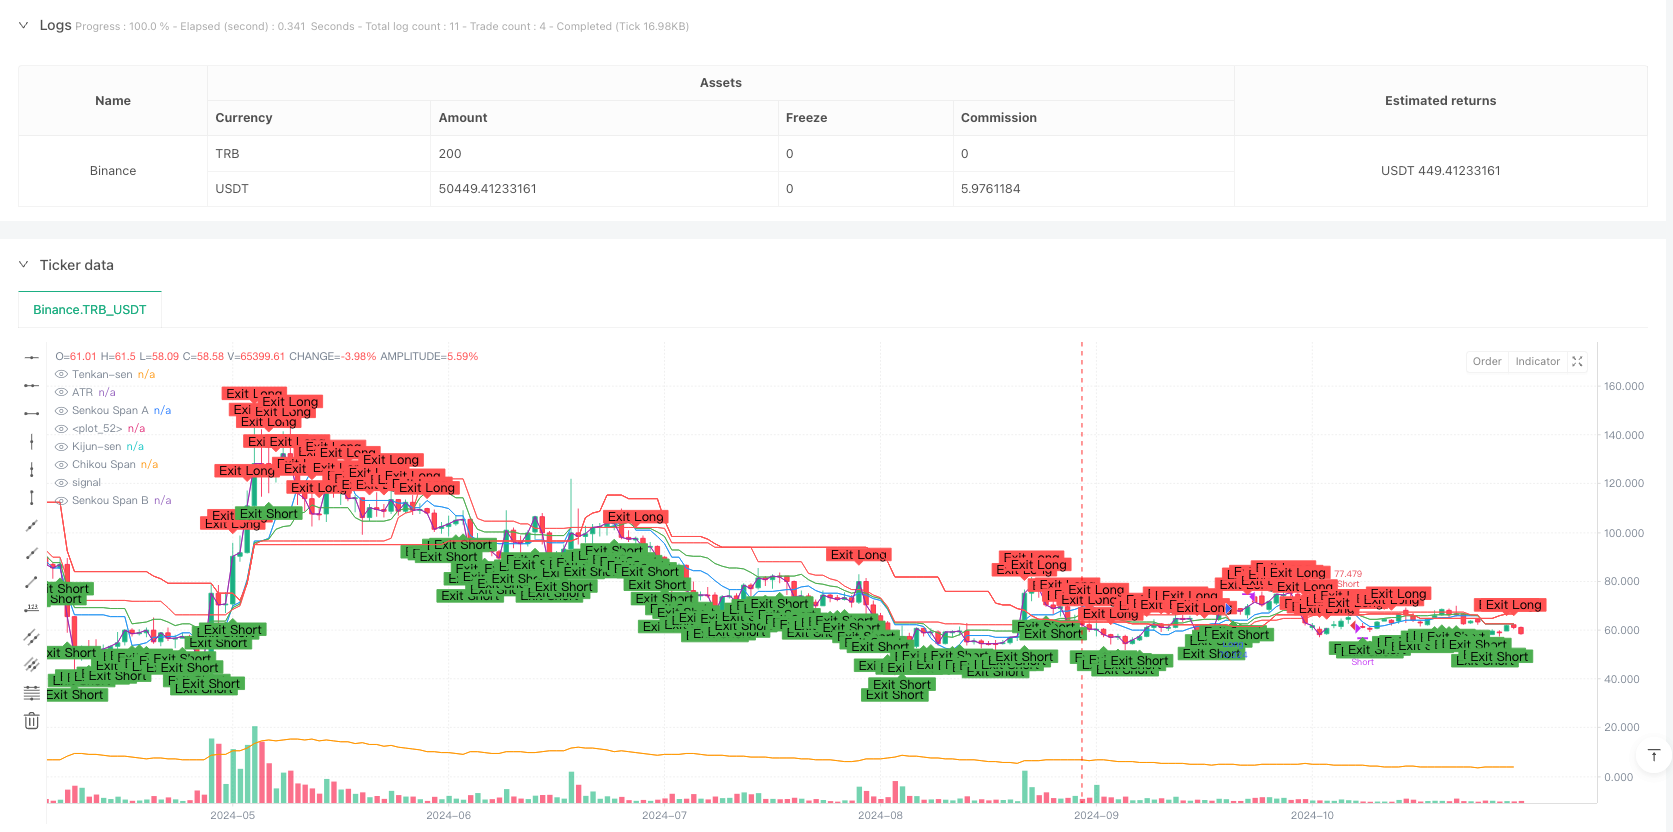
Tổng quan
Chiến lược này là một hệ thống giao dịch hoàn chỉnh kết hợp biểu đồ cân bằng đầu tiên (Ichimoku Cloud) và giá trị trung bình của độ dao động thực sự (ATR). Nó xác định xu hướng thị trường thông qua các thành phần biểu đồ đám mây, đồng thời sử dụng ATR để điều chỉnh động vị trí dừng lỗ, thực hiện sự kết hợp hữu cơ của theo dõi xu hướng và quản lý rủi ro. Chiến lược kết hợp hai chiều của thông tin thị trường về động lực và biến động, cung cấp một khuôn khổ phân tích toàn diện cho các quyết định giao dịch.
Nguyên tắc chiến lược
Logic cốt lõi của chiến lược được xây dựng trên năm đường trên biểu đồ cân bằng đầu tiên và chỉ số ATR. Hệ thống kích hoạt tín hiệu giao dịch bằng cách giao thoa giữa đường chuyển đổi ((Tenkan-Sen) và đường chuẩn ((Kijun-Sen), đồng thời yêu cầu giá nằm ở bên phải của đám mây ((Senkou Span A và B) và được xác nhận bởi đường trì hoãn ((Chikou Span).
- Làm nhiều điều kiện: Đường chuyển đổi xuyên qua đường chuẩn, giá trên đám mây, đường trì hoãn trên giá đóng cửa hiện tại
- Điều kiện làm trống: Chuyển đổi đường bên dưới đường viền, giá dưới đám mây, đường trì hoãn dưới giá đóng cửa hiện tại
- Cài đặt Stop Loss: Điều chỉnh động qua số nhân của ATR, mặc định là 1.5 lần ATR
- Điều kiện xuất phát: tín hiệu chéo ngược hoặc thay đổi vị trí dây chậm trễ
Lợi thế chiến lược
- Xác nhận đa chiều: kết hợp thông tin thị trường với nhiều chiều về xu hướng, động lực và biến động, nâng cao độ tin cậy của tín hiệu
- Quản lý rủi ro động: thiết lập dừng lỗ dựa trên ATR có thể tự động điều chỉnh theo biến động của thị trường, tránh nhược điểm của dừng lỗ cố định
- Hoạt động có hệ thống: có quy tắc chiến lược rõ ràng, có thể duy trì tính thống nhất và kỷ luật trong giao dịch
- Trực giác trực quan: Các nhà giao dịch có thể hiểu trực quan cấu trúc thị trường thông qua các biểu đồ trực quan trên đám mây
- Khả năng thích ứng: Các tham số có thể điều chỉnh để thích ứng với các môi trường thị trường khác nhau
Rủi ro chiến lược
- Rủi ro về sự chậm trễ: Các chỉ số biểu đồ cân bằng ban đầu tự có một sự chậm trễ, có thể dẫn đến sự chậm trễ trong thời gian nhập cảnh
- Rủi ro thị trường chấn động: Có thể có tín hiệu phá vỡ giả trong thị trường chấn động ngang
- Độ nhạy tham số: Cài đặt tham số cho các khoảng thời gian khác nhau có thể ảnh hưởng đáng kể đến hiệu suất chiến lược
- Lượng dừng lỗ: Lựa chọn ATR cần cân bằng giữa bảo vệ và lợi nhuận
- Tần số tín hiệu: Điều kiện nhập cảnh nghiêm ngặt có thể dẫn đến ít cơ hội giao dịch tương đối
Hướng tối ưu hóa chiến lược
- Thêm bộ lọc cường độ xu hướng: có thể thêm các chỉ số đo cường độ xu hướng như ADX, lọc môi trường xu hướng yếu
- Tối ưu hóa cơ chế dừng lỗ: Có thể xem xét đặt điểm dừng lỗ ở rìa đám mây hoặc điểm hỗ trợ / kháng cự quan trọng
- Tăng bộ lọc thời gian: Tránh các giai đoạn biến động như công bố dữ liệu kinh tế quan trọng
- Thêm xác nhận số lượng giao dịch: thêm số lượng giao dịch làm điều kiện bổ sung cho xác nhận tín hiệu
- Phát triển một phần quản lý vị trí: điều chỉnh tỷ lệ giữ vị trí theo cường độ tín hiệu và môi trường thị trường
Tóm tắt
Chiến lược dừng lỗ ATR của xu hướng sóng động là một hệ thống giao dịch hoàn chỉnh kết hợp các công cụ phân tích kỹ thuật cổ điển. Nó xác định xu hướng thông qua các cơ chế xác nhận đa dạng của biểu đồ cân bằng ngay lập tức và sử dụng ATR để kiểm soát rủi ro động, cung cấp cho các nhà giao dịch một khuôn khổ quyết định có hệ thống. Mặc dù có một số vấn đề về sự chậm trễ và nhạy cảm về tham số của chiến lược, nhưng thông qua việc tối ưu hóa và quản lý rủi ro hợp lý, nó có thể đạt được hiệu suất ổn định trong thị trường xu hướng. Tính năng trực quan và quy tắc rõ ràng của chiến lược làm cho nó đặc biệt phù hợp với các nhà đầu tư muốn thực hiện giao dịch có hệ thống.
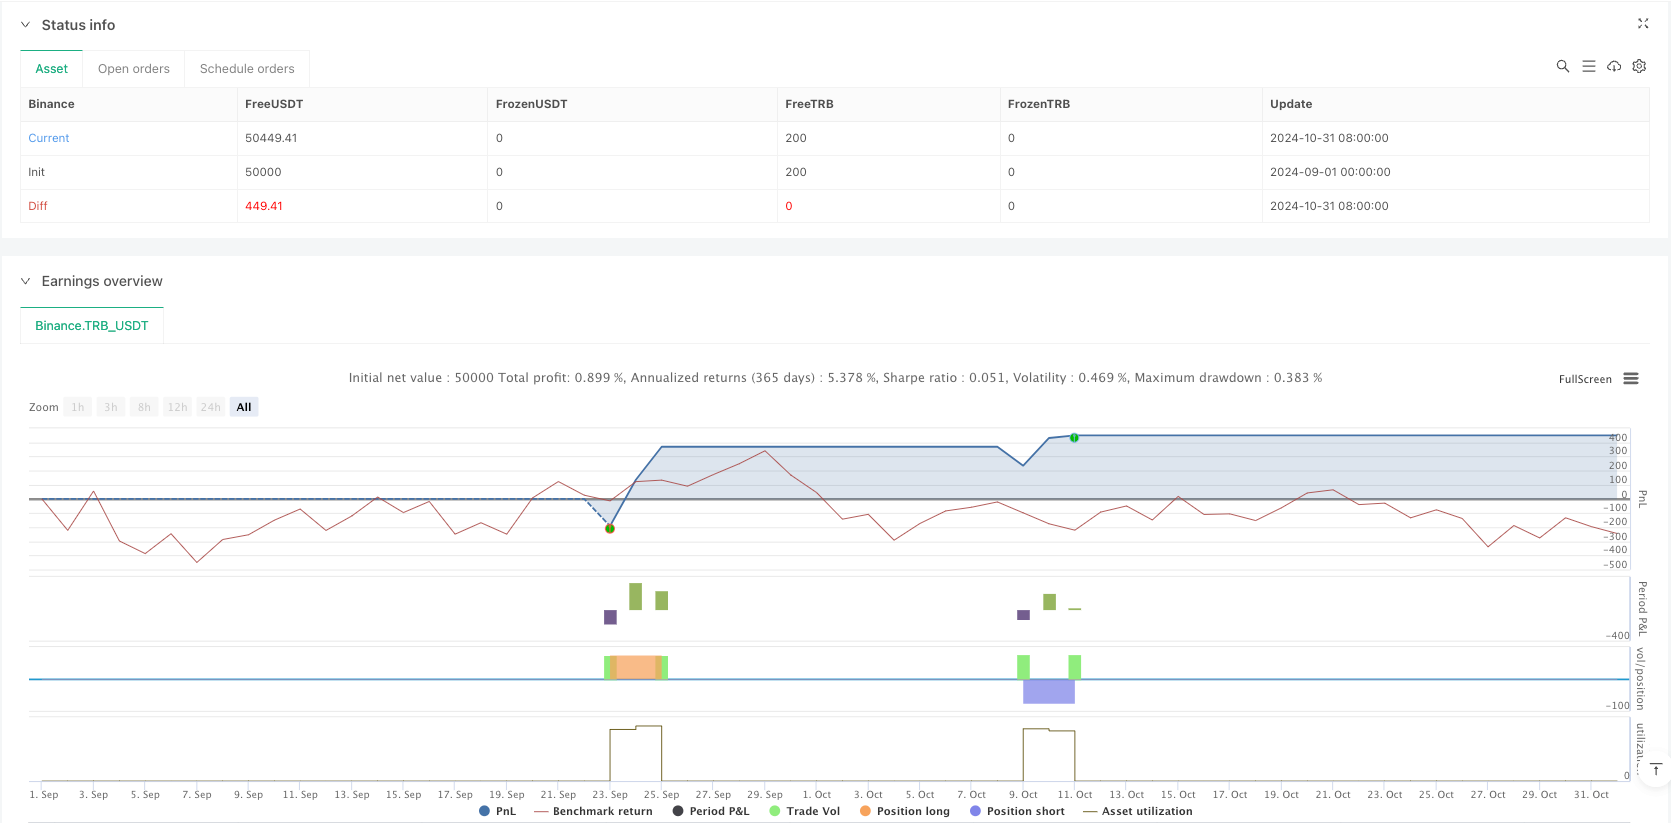
/*backtest
start: 2024-09-01 00:00:00
end: 2025-02-18 00:00:00
period: 1h
basePeriod: 1h
exchanges: [{"eid":"Binance","currency":"TRB_USDT"}]
*/

//@version=5
strategy("Ichimoku Cloud + ATR Strategy", overlay=true, default_qty_type=strategy.percent_of_equity, default_qty_value=10)

// === Inputs ===
conversionPeriods = input.int(9, title="Tenkan-sen Period", minval=1)
basePeriods = input.int(26, title="Kijun-sen Period", minval=1)
laggingSpan2Periods = input.int(52, title="Senkou Span B Period", minval=1)
displacement = input.int(26, title="Displacement", minval=1)
atrLength = input.int(14, title="ATR Period", minval=1)
atrMultiplier = input.float(1.5, title="ATR Multiplier for Stop-Loss", minval=0.1, step=0.1)

// === Indicator Calculations ===
// Ichimoku Cloud
tenkan = (ta.highest(high, conversionPeriods) + ta.lowest(low, conversionPeriods)) / 2
kijun = (ta.highest(high, basePeriods) + ta.lowest(low, basePeriods)) / 2
senkouSpanA = ta.sma((tenkan + kijun) / 2, 1)
senkouSpanB = (ta.highest(high, laggingSpan2Periods) + ta.lowest(low, laggingSpan2Periods)) / 2
chikouSpan = close[displacement]

// ATR
atr = ta.atr(atrLength)

// === Entry Conditions ===
longCondition = ta.crossover(tenkan, kijun) and close > senkouSpanA and close > senkouSpanB and chikouSpan > close
shortCondition = ta.crossunder(tenkan, kijun) and close < senkouSpanA and close < senkouSpanB and chikouSpan < close

// === Entry Signals with Stop-Loss ===
if (longCondition)
    longStop = close - (atrMultiplier * atr)
    strategy.entry("Long", strategy.long)
    strategy.exit("Long Exit", from_entry="Long", stop=longStop)

if (shortCondition)
    shortStop = close + (atrMultiplier * atr)
    strategy.entry("Short", strategy.short)
    strategy.exit("Short Exit", from_entry="Short", stop=shortStop)

// === Exit Conditions ===
exitLongCondition = ta.crossunder(tenkan, kijun) or chikouSpan < close
exitShortCondition = ta.crossover(tenkan, kijun) or chikouSpan > close

if (exitLongCondition)
    strategy.close("Long")

if (exitShortCondition)
    strategy.close("Short")

// === Plotting Indicators on the Chart ===
// Ichimoku Cloud
plot(senkouSpanA, color=color.green, title="Senkou Span A")
plot(senkouSpanB, color=color.red, title="Senkou Span B")
fill(plot(senkouSpanA, color=color.green), plot(senkouSpanB, color=color.red), color=close > senkouSpanA ? color.new(color.green, 90) : color.new(color.red, 90), title="Ichimoku Cloud")

// Tenkan-sen and Kijun-sen
plot(tenkan, color=color.blue, title="Tenkan-sen")
plot(kijun, color=color.red, title="Kijun-sen")

// Chikou Span
plot(chikouSpan, color=color.purple, title="Chikou Span", offset=-displacement)

// ATR (hidden)
plot(atr, color=color.orange, title="ATR", linewidth=1, display=display.none)

// === Signal Visualization ===
// Markers for Long and Short entries
plotshape(series=longCondition, title="Long Entry", location=location.belowbar, color=color.green, style=shape.labelup, text="Long")
plotshape(series=shortCondition, title="Short Entry", location=location.abovebar, color=color.red, style=shape.labeldown, text="Short")

// Markers for Long and Short exits
plotshape(series=exitLongCondition, title="Long Exit", location=location.abovebar, color=color.red, style=shape.labeldown, text="Exit Long")
plotshape(series=exitShortCondition, title="Short Exit", location=location.belowbar, color=color.green, style=shape.labelup, text="Exit Short")