Chiến lược giao dịch xu hướng động chỉ báo kép: Hệ thống phân tích kỹ thuật đa chiều dựa trên RSI và MACD
RSI MACD OB(Overbought) OS(Oversold) TA(Technical Analysis)
Ngày tạo:
2025-02-19 17:52:18
sửa đổi lần cuối:
2025-02-27 17:53:45
sao chép:
5
Số nhấp chuột:
546
2
tập trung vào
455
Người theo dõi
Tổng quan
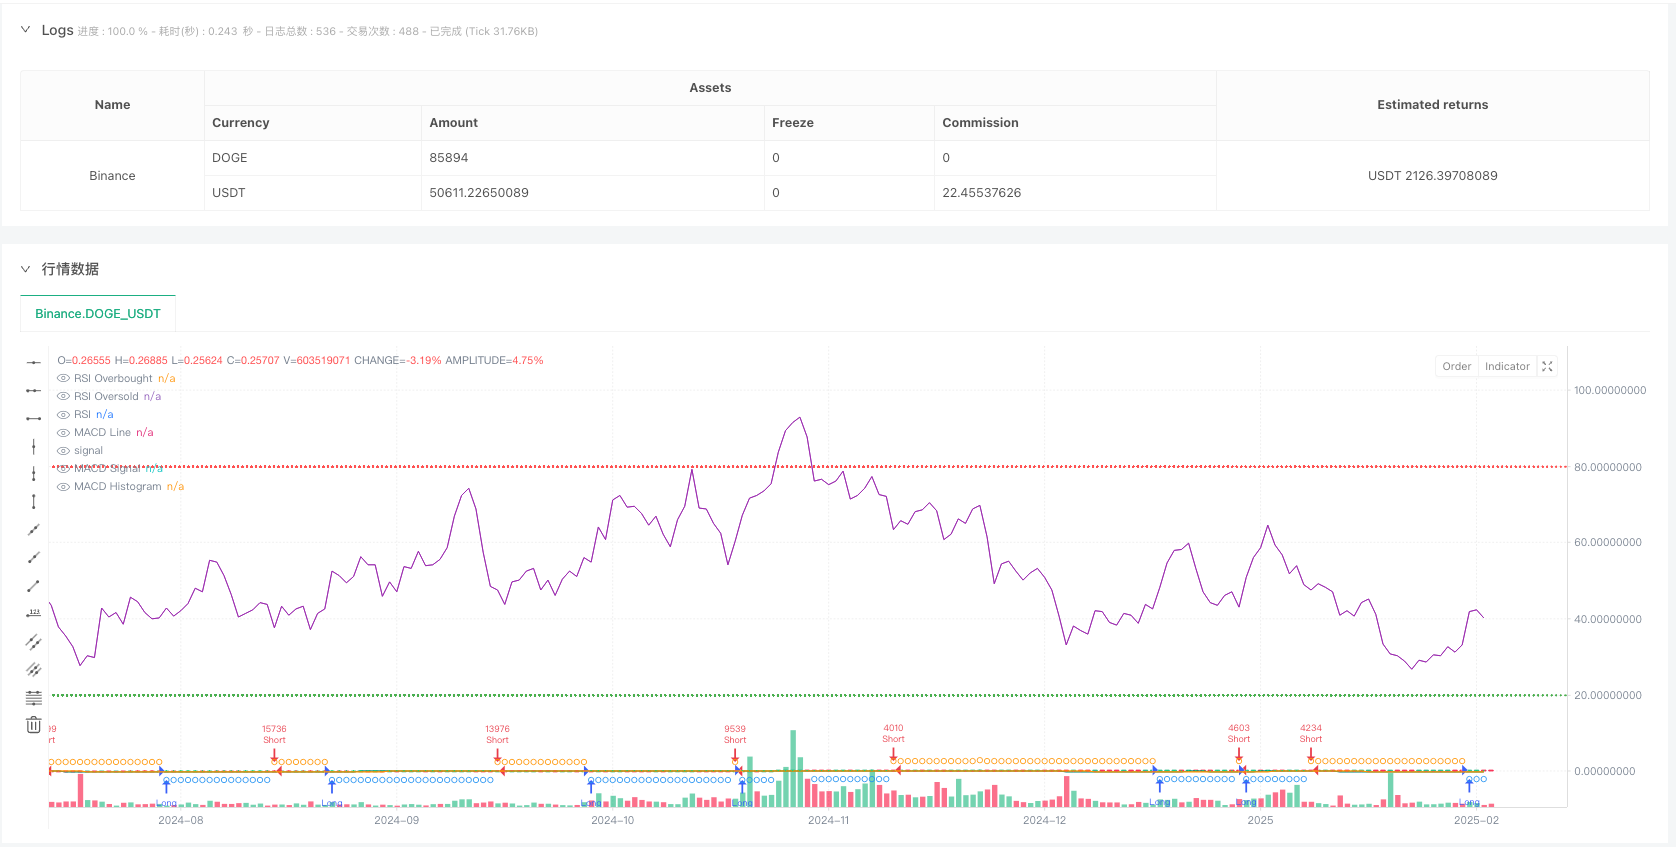
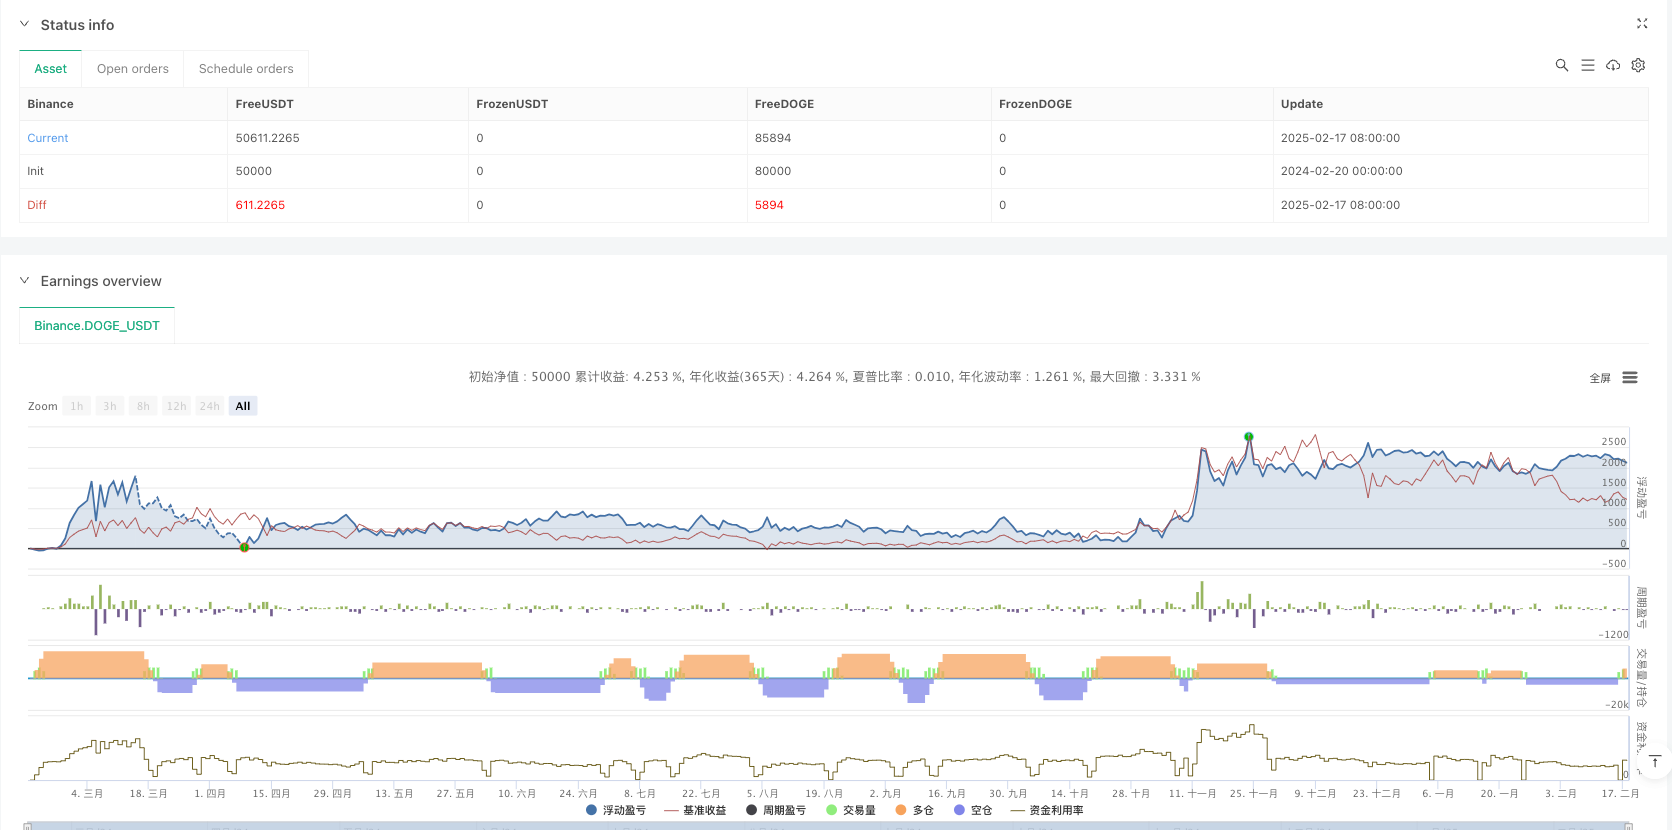
Đây là một chiến lược giao dịch tự động dựa trên các chỉ số kỹ thuật kép RSI và MACD. Chiến lược này xác định cơ hội giao dịch tiềm năng bằng cách kết hợp tín hiệu mua quá mức và xác nhận xu hướng để nắm bắt chính xác thị trường. Chiến lược này sử dụng quản lý vị trí tỷ lệ phần trăm và có cơ chế chống trượt tích hợp, có tính thực tế và thích ứng mạnh mẽ.
Nguyên tắc chiến lược
Lập luận cốt lõi của chiến lược dựa trên các yếu tố then chốt sau:
- Sử dụng chỉ số tương đối mạnh (RSI) để đánh giá quá mua quá bán, tham số được đặt thành 14 chu kỳ, giá quá mua 80, giá quá bán 20
- Sử dụng MACD ((12,26,9) để xác nhận xu hướng, xác định sự thay đổi xu hướng qua đường MACD và đường tín hiệu
- Tạo ra tín hiệu giao dịch phải đáp ứng cả hai điều kiện RSI và MACD:
- Điều kiện đa: RSI chưa đạt mức mua quá mức + đường MACD trên đường tín hiệu
- Điều kiện làm trống: RSI chưa đạt mức bán quá mức + đường MACD dưới đường tín hiệu
- Sử dụng 3% lợi nhuận tài khoản làm kích thước vị trí cho mỗi giao dịch và hạn chế tái tạo vị trí cho giao dịch đồng thời
Lợi thế chiến lược
- Việc sử dụng kết hợp các chỉ số kỹ thuật kép làm giảm đáng kể nguy cơ tín hiệu giả và tăng độ tin cậy giao dịch
- Quản lý tỷ lệ phần trăm giúp điều chỉnh động lực của tiền và kiểm soát rủi ro tốt hơn
- Cơ chế chống trượt tích hợp trong 3 điểm tăng cường khả năng thích ứng của chiến lược trong ổ đĩa thực
- Chiến lược hỗ trợ giao dịch hai chiều nhiều hơn để nắm bắt cơ hội thị trường
- Khoảng thời gian giao dịch có thể được tùy chỉnh để điều chỉnh theo các đặc điểm thị trường khác nhau
Rủi ro chiến lược
- RSI và MACD đều là các chỉ số chậm trễ, có thể không phản ứng kịp thời trong thị trường biến động nhanh
- Mức mốc mua bán cố định có thể cần điều chỉnh trong các môi trường thị trường khác nhau
- Vị trí cố định 3% có thể lớn hoặc nhỏ trong một số trường hợp
- Không có điều kiện dừng lỗ, có thể dẫn đến lợi nhuận bị thổi phồng hoặc tổn thất mở rộng
- Điều kiện chặt chẽ của chỉ số đôi có thể bỏ lỡ một số cơ hội giao dịch tiềm năng
Hướng tối ưu hóa chiến lược
- Tiếp theo, đưa ra các mức RSI thích ứng, điều chỉnh theo biến động của thị trường để xác định các tiêu chuẩn mua quá mức
- Thêm cơ chế dừng lỗ, khuyến nghị đặt điểm dừng động dựa trên ATR hoặc tỷ lệ biến động
- Tối ưu hóa hệ thống quản lý vị trí, có thể xem xét việc điều chỉnh kích thước vị trí theo biến động thị trường và biến động giá trị tài khoản
- Thêm bộ lọc môi trường thị trường, điều chỉnh các tham số chiến lược hoặc tạm dừng giao dịch trong các điều kiện thị trường khác nhau
- Xem xét việc đưa ra các chỉ số giao dịch như là xác nhận phụ trợ, tăng độ tin cậy của tín hiệu
Tóm tắt
Chiến lược này xây dựng một hệ thống giao dịch tương đối ổn định thông qua sự phối hợp của RSI và MACD. Mặc dù có một số rủi ro bị tụt hậu, chiến lược vẫn có giá trị thực tế tốt thông qua kiểm soát rủi ro và tối ưu hóa tham số hợp lý.
Mã nguồn chiến lược
//@version=6
strategy("Debugging Demo GPT",
         overlay=true,
         initial_capital=100,
         default_qty_type=strategy.percent_of_equity,
         default_qty_value=3,
         pyramiding=1,
         calc_on_order_fills=true,
         calc_on_every_tick=true,
         slippage=3)

// -----------------------------------------------------------------------
//   (1) Inputs: Start and End Date
// -----------------------------------------------------------------------


// -----------------------------------------------------------------------
//   (2) Indicators (RSI, MACD)
// -----------------------------------------------------------------------

// === RSI ===
rsiLen = input.int(14, "RSI Length")
rsiOB  = input.int(80, "RSI Overbought")
rsiOS  = input.int(20, "RSI Oversold")
rsiVal = ta.rsi(close, rsiLen)

// === MACD ===
fastLen  = input.int(12, "MACD Fast Length")
slowLen  = input.int(26, "MACD Slow Length")
sigLen   = input.int(9,  "MACD Signal Length")
[macdLine, sigLine, histLine] = ta.macd(close, fastLen, slowLen, sigLen)

// -----------------------------------------------------------------------
//   (3) Trading Logic: LONG/SHORT Filters
// -----------------------------------------------------------------------

bool rsiLongOk   = (rsiVal < rsiOB)
bool rsiShortOk  = (rsiVal > rsiOS)
bool macdLongOk  = (macdLine > sigLine)
bool macdShortOk = (macdLine < sigLine)

bool longCondition  = rsiLongOk and macdLongOk
bool shortCondition = rsiShortOk and macdShortOk

// -----------------------------------------------------------------------
//   (4) Entry Conditions
// -----------------------------------------------------------------------

// Debugging: Visualizing the conditions
plotshape(series=longCondition, location=location.belowbar, color=color.blue, style=shape.circle, title="LongCondition", size=size.tiny)
plotshape(series=shortCondition, location=location.abovebar, color=color.orange, style=shape.circle, title="ShortCondition", size=size.tiny)

// Entries only when all conditions are met
if longCondition
    strategy.entry("Long", strategy.long)
if shortCondition
    strategy.entry("Short", strategy.short)

// -----------------------------------------------------------------------
//   (5) Plotting for Visualization
// -----------------------------------------------------------------------

// RSI Plots
hline(rsiOB, "RSI Overbought", color=color.red, linestyle=hline.style_dotted)
hline(rsiOS, "RSI Oversold", color=color.green, linestyle=hline.style_dotted)
plot(rsiVal, title="RSI", color=color.purple)

// MACD Plots
plot(macdLine, color=color.teal, title="MACD Line")
plot(sigLine, color=color.orange, title="MACD Signal")
plot(histLine, style=plot.style_histogram, color=(histLine >= 0 ? color.lime : color.red), title="MACD Histogram")