
Tổng quan
Đây là một hệ thống chiến lược giao dịch tần số cao kết hợp các dải Bollinger Bands, phân tán trung bình di chuyển MACD và phân tích khối lượng giao dịch. Chiến lược này nắm bắt cơ hội đảo ngược thị trường bằng cách xác định các đợt phá vỡ và quay trở lại của giá trong vùng Bollinger Bands, kết hợp với chỉ số MACD và xác nhận khối lượng giao dịch. Hệ thống đặt giới hạn số lần giao dịch tối đa mỗi ngày và được trang bị cơ chế quản lý rủi ro hoàn hảo.
Nguyên tắc chiến lược
Chiến lược này dựa trên ba chỉ số cốt lõi:
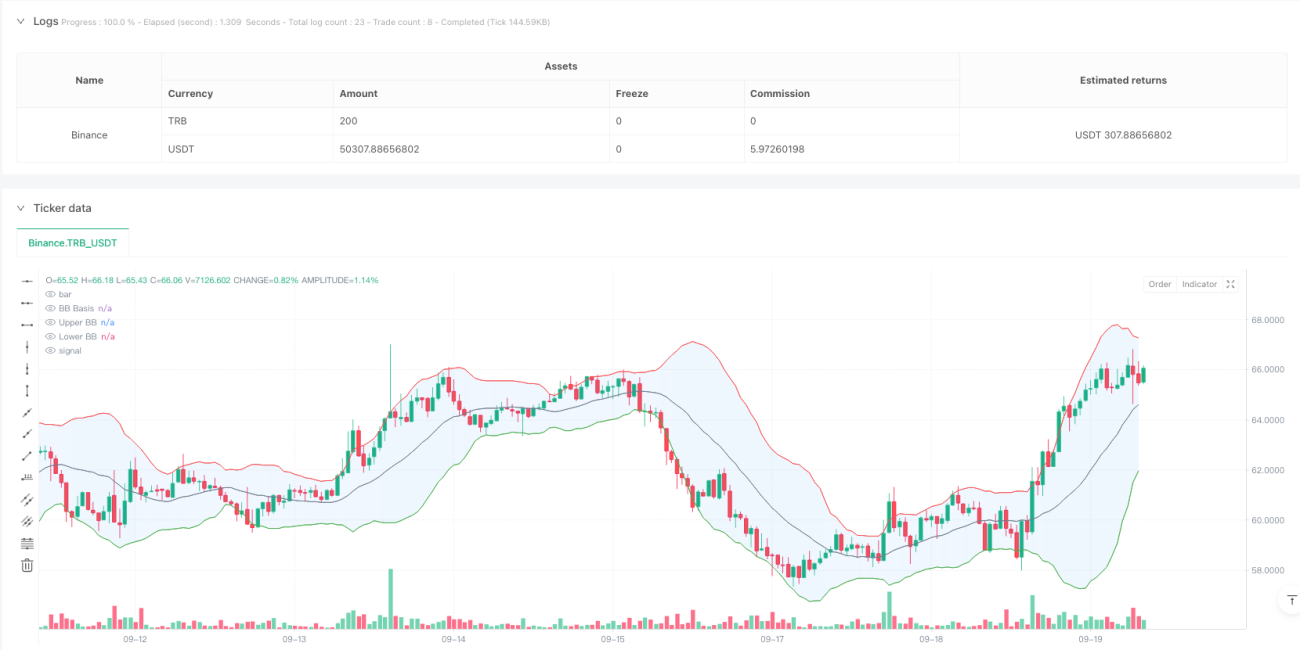
- Chỉ số Brin: Sử dụng đường trung bình di chuyển đơn giản ((SMA) 20 chu kỳ làm đường trung bình, số chênh lệch chuẩn là 2.0 được tính trên đường xuống. Khi giá vượt qua Brin và quay trở lại, hệ thống sẽ phát ra tín hiệu giao dịch tiềm năng.
- Chỉ số MACD: sử dụng thiết lập tham số tiêu chuẩn ((12,26,9), để xác nhận động lực của xu hướng giá. Khi đường MACD nằm trên đường tín hiệu, xác nhận tín hiệu nhiều và khi nằm dưới đường tín hiệu, xác nhận tín hiệu ngắn.
- Phân tích khối lượng giao dịch: Sử dụng trung bình di chuyển 20 chu kỳ để xác nhận khối lượng giao dịch, yêu cầu khối lượng giao dịch khi tín hiệu xuất hiện ít nhất đạt mức trung bình để đảm bảo sự tham gia của thị trường.
Lợi thế chiến lược
- Xác nhận đa tín hiệu: Tăng đáng kể độ tin cậy của tín hiệu giao dịch thông qua xác minh ba lần của băng Brin, MACD và khối lượng giao dịch.
- Thiết kế trực quan: Hệ thống cung cấp các chỉ dẫn biểu đồ phong phú, bao gồm lấp đầy các dải Brin, đánh dấu tín hiệu và thay đổi màu nền, giúp các nhà giao dịch nhanh chóng nhận ra cơ hội giao dịch.
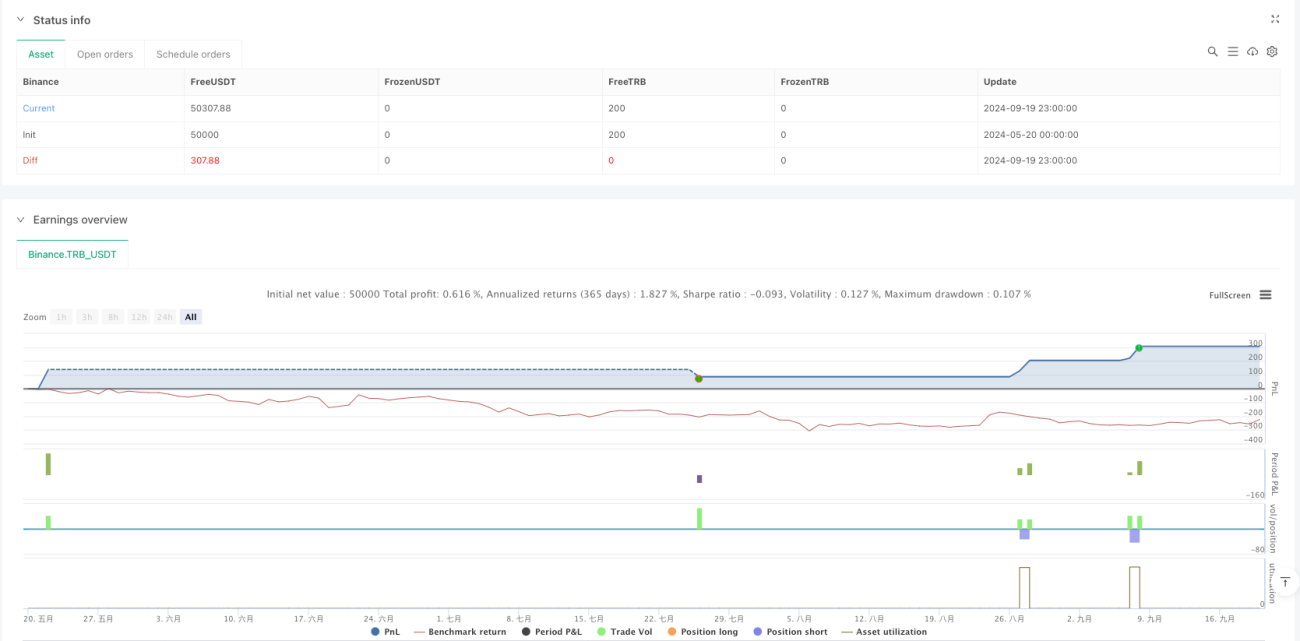
- Kiểm soát rủi ro hoàn hảo: Thực hiện mục tiêu dừng lỗ và lợi nhuận cố định và giới hạn số lần giao dịch tối đa mỗi ngày, kiểm soát hiệu quả lỗ hổng rủi ro.
- Hoạt động có hệ thống: Chiến lược cung cấp các điều kiện nhập cảnh và xuất cảnh rõ ràng, giảm bớt sự không chắc chắn của phán đoán chủ quan.
Rủi ro chiến lược
- Rủi ro biến động thị trường: Trong thị trường biến động cao, có thể có tín hiệu phá vỡ giả tạo, dẫn đến mất giao dịch.
- Rủi ro trượt: Trong môi trường giao dịch tần số cao, có thể phải đối mặt với chi phí trượt lớn, ảnh hưởng đến lợi nhuận thực tế.
- Rủi ro thanh khoản: Điều kiện khối lượng giao dịch có thể hạn chế cơ hội giao dịch khi thị trường thiếu thanh khoản.
- Rủi ro hệ thống: Các thiết lập tham số cố định có thể không thích ứng với những thay đổi mạnh mẽ của điều kiện thị trường.
Hướng tối ưu hóa chiến lược
- Tối ưu hóa động của tham số: Có thể giới thiệu cơ chế điều chỉnh tham số thích ứng, cho phép tham số Brin và MACD tự động điều chỉnh theo điều kiện thị trường.
- Nhận biết chu kỳ thị trường: thêm mô-đun phán đoán chu kỳ thị trường, sử dụng chiến lược giao dịch khác nhau trong các chu kỳ thị trường khác nhau.
- Tối ưu hóa quản lý rủi ro: Có thể xem xét giới thiệu cơ chế dừng động, điều chỉnh vị trí dừng lỗ theo biến động của thị trường.
- Tăng cường bộ lọc tín hiệu: Tăng bộ lọc cường độ xu hướng để tránh quá nhiều tín hiệu giao dịch trên thị trường ngang.
Tóm tắt
Chiến lược này xây dựng một hệ thống giao dịch hoàn chỉnh thông qua sự kết hợp của tín hiệu đảo ngược vòng Brin, xác nhận xu hướng MACD và xác minh khối lượng giao dịch. Thiết kế trực quan của hệ thống và kiểm soát rủi ro nghiêm ngặt làm cho nó đặc biệt phù hợp với giao dịch trong ngày. Mặc dù có một số rủi ro thị trường, chiến lược này có khả năng duy trì hiệu suất ổn định trong các môi trường thị trường khác nhau thông qua việc tối ưu hóa và điều chỉnh tham số liên tục.
- 1